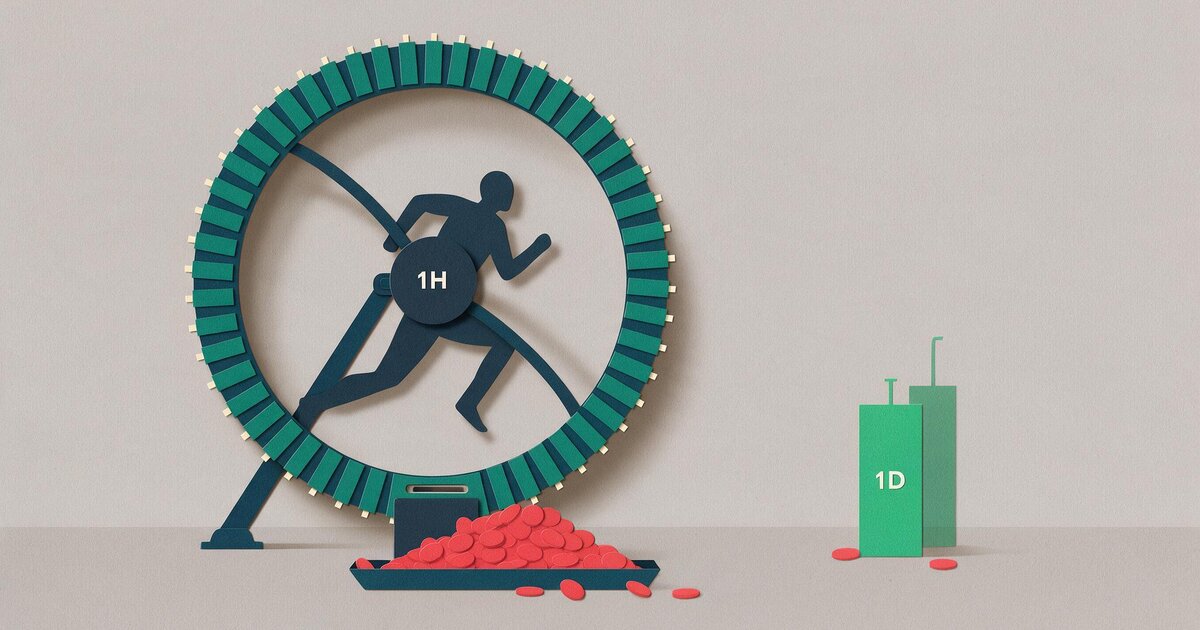
Most KreamEdge research runs on daily bars. Newcomers to systematic trading often go the other way and start on hourly charts, because an hourly chart moves while you watch it and a daily chart does not. This note measures what changes when you switch from 1D to 1H: the size of a typical bar (NATR), the share of that bar a round trip in fees and spread costs, what leverage does to that ratio, and what a faster chart does to the person running the strategy.
This is research methodology. The figures below are measured on historical price data from KreamEdge’s research database and on KreamEdge’s backtest cost assumptions; they are not a live track record, and nothing here is a trading signal. We would not trade any strategy described here as-is: it is research only. Past performance is not indicative of future results. Not financial advice. See our community page for the full disclaimer.
Key points
- On 19 liquid instruments from November 2024 to October 2026, a typical hourly bar moved about one third as much as a typical daily bar: median NATR of 0.71% against 2.13% on US large caps, 0.75% against 2.40% on Paris large caps, and 0.91% against 5.49% on bitcoin and ether.
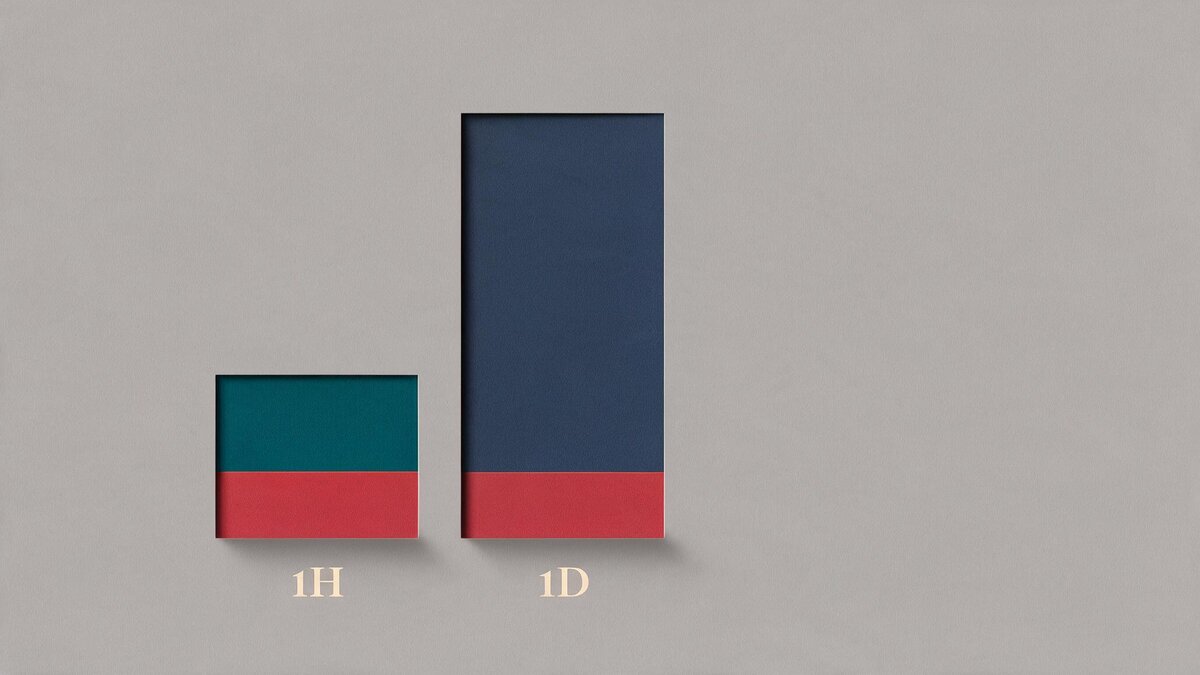
- A round trip costs the same in percent whatever the bar size. Measured in bars, it is three to six times heavier on 1H: 0.28 hourly bars against 0.09 daily bars on US large caps, 1.11 hourly bars against 0.19 daily bars on crypto.
- On a Kaufman efficiency-ratio test, hourly and daily price paths were both close to a random walk. In this sample, the case for daily bars rests on cost and on behavior, not on hourly charts being noisier.
- Leverage multiplies the move and the fee by the same factor, so it cannot improve the cost-to-move ratio. Making an hourly bar pay like a daily bar takes about 3x leverage on equities and 6x on crypto.
- An hourly chart produces 7 to 24 new bars a day and as many reasons to intervene. Daily bars computed after the close let a fully automated strategy run without anyone watching it.
- Hourly bars have real advantages: more trades for statistical validation, no overnight gap risk for flat-at-close systems, and a diversifying return stream. They need a cost structure and a level of automation most beginners do not have.
Which bar size should a trading strategy use?
Use the longest bar size that still fits the edge your rules are built to capture, and check that a round trip costs only a small fraction of one bar’s typical range on that bar size. For most retail systematic strategies on equities and crypto, that points to daily bars. On our sample, a round trip cost 0.09 to 0.25 of a daily bar and 0.28 to 1.11 of an hourly bar.
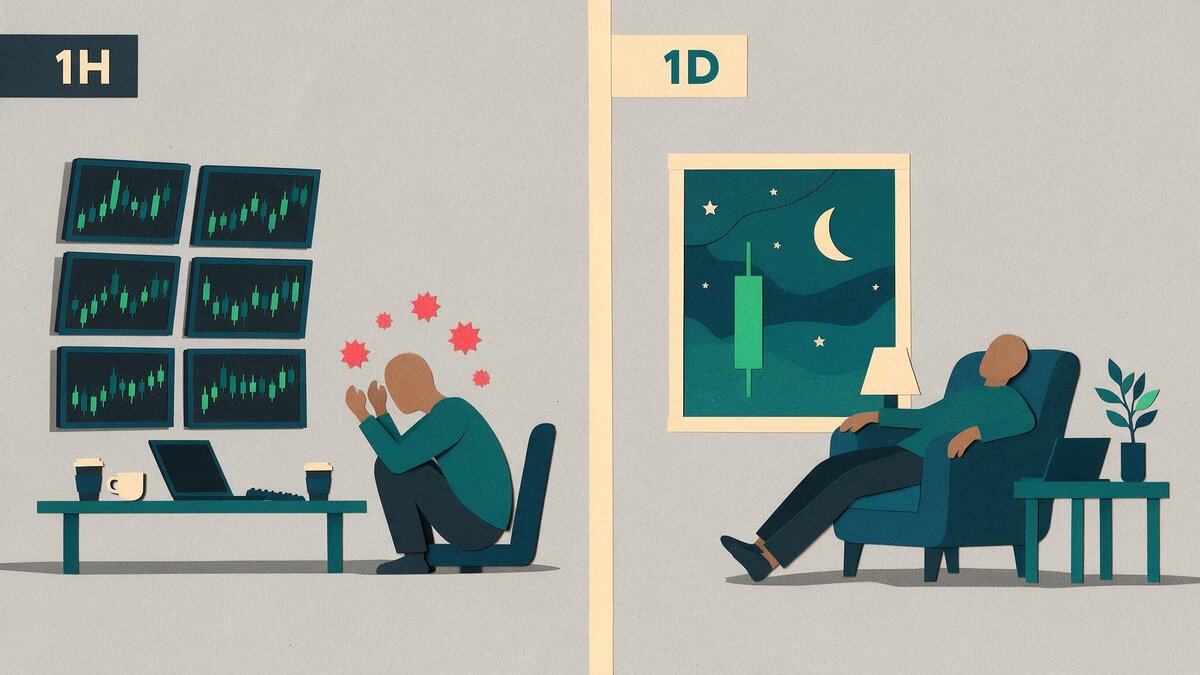
Bar size is also an operational choice. A daily strategy can compute its decisions once, after the close, and send its orders without a person in the loop. An hourly strategy that is not fully automated asks you to make a decision every hour of the session, and every decision is a chance to override the rules.
The rest of this note shows the measurements behind those two claims, then gives the cases where an hourly bar size is the better choice.
What NATR measures and why it shrinks with the bar size
NATR, the normalized average true range, is the average true range of the last 14 bars divided by the closing price, in percent. It tells you how far price typically travels within one bar, in units you can compare across instruments and bar sizes. A daily NATR of 2% means a typical day spans about 2% of the price, gaps included.
We computed NATR(14) with Wilder’s smoothing on hourly and daily bars from the KreamEdge research database, then took the median per instrument from 1 November 2024 to 31 October 2026. The sample has ten US large caps and ETFs (Apple, Amazon, Meta, Microsoft, Nvidia, QQQ, Johnson & Johnson, JPMorgan, Procter & Gamble, Exxon Mobil), seven Paris large caps (Air Liquide, Airbus, BNP Paribas, LVMH, L’Oréal, Schneider Electric, TotalEnergies) and two crypto pairs (BTC and ETH in USD).
| Group | Hourly bars per session | Median NATR 1H | Median NATR 1D | Daily / hourly |
|---|---|---|---|---|
| US large caps (10) | 7 | 0.71% | 2.13% | 3.0x |
| Paris large caps (7) | 9 | 0.75% | 2.40% | 3.4x |
| Crypto, BTC and ETH (2) | 24 | 0.91% | 5.49% | 6.0x |
The ratio follows the number of hourly bars in a session. A US session has seven hourly bars and a daily bar about three times the hourly range. Crypto trades around the clock, so its daily bar holds 24 hourly bars and spans six times the hourly range.
An hourly bar moves a third as much, but the fee is the same
A round-trip cost is a percentage of the position, so it does not shrink when the bar does. Divide the round-trip cost by the median NATR and you get the cost of one round trip in bars: how much of a typical bar your trade spends before it can make anything. On US large caps that figure is 0.09 of a daily bar and 0.28 of an hourly bar.
| Group | Round-trip cost assumed | Cost in hourly bars | Cost in daily bars |
|---|---|---|---|
| US large caps | 0.20% | 0.28 | 0.09 |
| Paris large caps | 0.60% | 0.80 | 0.25 |
| Crypto, BTC and ETH | 1.00% | 1.11 | 0.19 |
The costs are the ones the KreamEdge backtester charges: 0.1% per side on most equities, 0.3% per side on Paris listings (broker fee plus the French financial transaction tax, spread over both sides) and 0.5% per side on crypto (fee plus a spread and slippage buffer). Your own costs may be lower or higher. The ratio is what matters, and you can compute it for your own broker in a minute.
On crypto, at these costs, one hourly round trip costs more than a typical hourly bar. A strategy that holds for a few hourly bars needs a large, reliable move just to break even. The same trade on daily bars spends a fifth of one bar.
Kevin Davey made the same observation on Better System Trader episode 207, from repeated testing on futures:
Every time I’ve tested it, it’s come out the same way, that the bigger the bar size, the better off and the easier it is to create strategies. And that could be a combination of less noise in the bars, so you have more signal, if you want to call it that, you have more trends, and those trends are bigger relative to your trading costs.
Kevin Davey, Better System Trader episode 207, December 2021
In the same answer he gives a futures example: a one-minute system trading ten times a day with market orders needs about $150 a day just to cover fixed costs, against about $15 for a system taking one trade a day. John Ehlers made the per-bar version of the point on episode 58: on one-minute bars, the expected profit from a single swing can be smaller than the transaction cost. Bert Mouler, on episode 64, framed it as the ratio between the bid-ask spread and the average move over the holding period; when that ratio is high, short holding periods are not viable.
Are hourly charts noisier than daily charts?
Not on our sample. We used the Kaufman efficiency ratio: the net move over a window divided by the sum of the bar-to-bar moves, from 0 (all back and forth) to 1 (a straight line). On hourly bars within each session and on daily bars over 21-session windows, the median ratio sat close to what a simulated random walk with the same number of steps produces.
| Path | Steps | Median efficiency ratio | Random walk, same steps |
|---|---|---|---|
| US large caps, hourly within a session | 6 | 0.37 | 0.41 |
| Paris large caps, hourly within a session | 8 | 0.32 | 0.35 |
| Crypto, hourly within a UTC day | 23 | 0.20 | 0.20 |
| All 19 instruments, daily over 21 sessions | 20 | 0.20 | 0.21 |
Equity hourly paths showed slightly more back and forth than the random walk, and daily paths sat close to it. Neither horizon looks clean. If the decision rested on noise alone, this sample would not settle it.
Practitioners disagree on the same question. Perry Kaufman (episode 10) and Gary Stone (episode 8) describe higher-frequency data as noisier. Adam Grimes (episode 188) argues the reverse: higher timeframes tend to look more random statistically, and lower timeframes show more departures from a random walk, provided you pick your moments. Martyn Tinsley (episode 200) found noise falling from one-minute bars up to about H1 and then rising again on four-hour and daily charts. Grimes adds the condition that matters for costs:
I have no business putting risk on in a market if a market is just bouncing around randomly. That’s a great way for me at best to pay transaction costs and maybe make a mistake.
Adam Grimes, Better System Trader episode 188, May 2021
That is why this note leans on the cost-to-move ratio. Whether or not hourly bars carry more exploitable structure, each hourly trade starts further behind.
Leverage does not fix the cost-to-move ratio
Leverage scales the position, so it scales the move and the fee by the same factor. A round trip that costs 0.28 of an hourly bar at 1x still costs 0.28 of an hourly bar at 3x. What leverage changes is the size of the loss when a trade goes wrong, the financing charge on borrowed money, and the gap you cannot exit.
To make an hourly position produce the same currency move as an unlevered daily position, you need leverage equal to the daily-to-hourly NATR ratio: about 3x on US and Paris large caps and 6x on bitcoin and ether. At that point the fees per trade are three to six times larger in currency, and they are paid on every hourly round trip.
Adrian Reid described the crypto version on episode 206: newcomers combine a very volatile market with the 10x to 50x leverage exchanges offer, and blow up. Linda Raschke, on episode 49, described the opposite habit: she sizes positions as a number of contracts per 100,000 of capital, set by the daily dollar range of each market, and uses less leverage when ranges widen. Our post on risk management, volatility and bias covers how leverage and volatility combine during a drawdown.
Trading frequency multiplies the fee
Annual cost drag is the round-trip cost times the number of round trips a year. A strategy that opens and closes one position per session pays about 50% of the position’s notional per year in US equity costs, at 0.20% per round trip. A daily strategy averaging two round trips a month pays 4.8%.
| Group | One round trip per session | Two round trips per month |
|---|---|---|
| US large caps (0.20%) | 50% a year (252 sessions) | 4.8% a year |
| Paris large caps (0.60%) | 151% a year (252 sessions) | 14.4% a year |
| Crypto, BTC and ETH (1.00%) | 365% a year (365 days) | 24% a year |
Nick Radge described the small-account version on episode 92: a beginner whose strategy made 300 round turns a year at $10 per trade needed 22% a year just to break even. Moritz, on the Trading Panel (episode 228), built a futures cost model the same way, from per-lot costs times round turns per year; his illustrative example came to 1.7% of capital a year. The method transfers to any market: count the round trips first, then decide whether the edge can carry them.
Why an hourly chart feels better to a beginner
An hourly chart prints a new bar seven to 24 times a day, and each bar is a small win or a small threat. That frequent, unpredictable feedback is what people mean when they talk about the dopamine of trading: it pulls you back to the screen whether or not there is anything to do. A daily chart prints once, after the close, and gives you nothing to react to during the day.
Several Better System Trader guests describe this pattern from their own experience. On the Trading Panel (episode 230), one panelist observed that most new traders try to be far more short-term than they need to be. Cesar Alvarez put the behavioral risk directly:
A lot of people like to look because they get the thrill of seeing things go up and down, and that actually to me is a bad sign. … Systematic trading should be boring. … If you’re trying to get excitement out of that, that’s just not good because you’re going to override your systematic signals.
Cesar Alvarez, Better System Trader episode 221, January 2024
John Carter, on episode 136, described how a seven-point S&P sell-off can look like a disaster on a five-minute chart and like an ordinary pullback on the daily chart. Adrian Reid described the cost of following the crowd:
I thought, well, everyone else is day trading. Maybe I’ll try day trading, see what all the fuss is about. And I tried it, and I lost about $30,000 trading that system before I even realized what was going on.
Adrian Reid, Better System Trader episode 147, May 2018
Automation on daily bars takes the screen out of the loop
A systematic strategy on daily bars can run without anyone watching it during the session. The rules are evaluated after the close, the orders are prepared for the next session, and the result is reviewed on a schedule. There is no intraday decision to make, so there is no intraday decision to get wrong.
KreamEdge’s research engine works this way: daily bars, with each strategy’s output computed once per session after the close. Adrian Reid described the same setup on episode 206: six systems on daily bars that took him about two and a half minutes one morning, after which he was done for the day.
Full automation is much easier to reach on daily bars. Cesar Alvarez noted on episode 195 that even a fully automated day-trading system still needs watching during the session, because things break. A daily system that fails can usually wait for the next close; an hourly one keeps trading.
When an hourly bar size makes sense
Hourly bars are the better choice when the edge exists only intraday, when costs are low relative to the hourly range, and when the strategy is fully automated. They also produce many more trades, which shortens the time needed to validate a strategy. KreamEdge has published two hourly backtests as research for those reasons.
- Sample size. Stefano Serafini (episode 112) compared about 250 trades in ten years for a daily system with about 1,000 for an intraday one. More trades per parameter make a backtest easier to validate; see how many trades per parameter a backtest needs.
- No overnight risk. Gary Hart (episode 85) and Serafini both cite it for systems that are flat at the close.
- Robustness for some styles. Tomas Nesnidal (episode 43) found that his breakout strategies failed robustness tests on daily and weekly bars, and trades them on 15 to 60 minute bars with a daily filter.
- Diversification. Pavel, on the Trading Panel (episode 223), reported that the same strategy run on a bar size about three times shorter produced returns with a correlation around 0.25 to 0.3 to the original.
- Low cost per bar. Where the round trip is a small fraction of the hourly NATR, as on liquid US large caps in our sample (0.28 bars), the cost argument weakens.
The same guests attach conditions. Serafini names a high average trade as the main difficulty of intraday systems, and a panelist on episode 228 noted that the intraday traders he knows who lasted trade systematically, with rules rather than judgment calls.
How to choose a bar size for your strategy
Choose the bar size with numbers before you look at any backtest result. The steps below take an afternoon with your own data and your own broker’s fee schedule, and they rule out most bar sizes that cannot pay for themselves.
- Write down your round-trip cost in percent: commissions, spread, slippage and any transaction tax, at the position size you intend to trade.
- Compute the median NATR(14) of your universe on each candidate bar size, over at least one year.
- Divide the cost by the NATR. That is your cost in bars: the share of a typical bar each trade spends before it can make anything.
- Estimate the round trips per year your rules will make, and multiply by the round-trip cost to get the annual drag.
- Do not use leverage to close the gap. It scales the fee with the move.
- Decide who executes. If you will watch every bar and act on it by hand, choose a bar size you can leave alone, or automate first.
- Check that the bar size you picked still gives enough trades per parameter to validate the strategy.
Bar size FAQ
Is 1H or 1D better for algorithmic trading?
Daily bars suit most retail algorithmic strategies on equities and crypto because a round trip costs a much smaller share of a daily bar. On 19 liquid instruments from 2024 to 2026, a round trip cost 0.09 to 0.25 of a daily bar and 0.28 to 1.11 of an hourly bar at KreamEdge’s cost assumptions. Hourly bars can work when costs are low and execution is fully automated.
How do I use NATR to choose a timeframe?
Divide your round-trip trading cost by the median NATR of your instruments on each candidate bar size. The result is the cost of one round trip in bars. The higher it is, the larger the average trade your rules need just to break even. On KreamEdge’s sample, switching from daily to hourly bars multiplied this ratio by three on equities and by six on crypto.
Can leverage make an hourly strategy pay like a daily one?
Leverage can make an hourly position move as much money as an unlevered daily position, at about 3x on large-cap equities and 6x on crypto in KreamEdge’s sample. It does not improve the ratio of cost to move, because fees scale with the position. It adds financing costs and larger losses on adverse moves and gaps.
Are lower timeframes noisier than daily charts?
Not clearly. On a Kaufman efficiency-ratio test over 2024 to 2026, KreamEdge found hourly paths within a session and daily paths over 21 sessions both close to a random walk. Practitioners disagree: some describe more noise at higher frequency, others find more structure intraday. The stronger argument for daily bars is cost per bar.
Does a daily strategy produce enough trades to validate?
Often not on a single instrument. A daily system may produce about 250 trades in ten years against 1,000 for an intraday one, an example cited on Better System Trader episode 112. A daily strategy can raise its trade count by running across a broad universe of instruments, and it should be checked against a trades-per-parameter rule before its results are trusted.
Sources
- Better System Trader podcast, hosted by Andrew Swanscott: episodes 8 (Gary Stone), 10 (Perry Kaufman), 43 (Tomas Nesnidal), 49 (Linda Raschke), 58 (John Ehlers), 64 (Bert Mouler), 85 (Gary Hart), 92 (Nick Radge), 112 (Stefano Serafini, August 2017), 136 (John Carter, November 2017), 147 (Adrian Reid, May 2018), 188 (Adam Grimes, May 2021), 195 (Cesar Alvarez, July 2021), 200 (Martyn Tinsley, September 2021), 206 (Adrian Reid, November 2021), 207 (Kevin Davey, December 2021), 221 (Cesar Alvarez, January 2024), and the Trading Panel episodes 223, 228 and 230 (February and March 2024). Episode archive.
- Perry J. Kaufman, Trading Systems and Methods, Wiley, for the efficiency ratio.
- KreamEdge measurements: hourly and daily OHLC bars from the KreamEdge research database, 1 November 2024 to 31 October 2026; NATR(14) with Wilder’s smoothing; costs from the KreamEdge backtester’s default assumptions.
On the sourcing: material in block quotes is transcribed from the episode transcripts, cleaned for punctuation, filler words and transcription errors but never for meaning, with an ellipsis marking any omission. Everything else attributed to a guest is a paraphrase of their argument in KreamEdge’s words. Guests are named as the episode titles or the hosts name them; panelists named only by first name in the episode are named the same way here. The KreamEdge figures are measurements on historical price data, not audited results.
KreamEdge has no affiliation with Better System Trader, any guest or any author cited above, and no citation is an endorsement.
Closing
A faster chart gives a strategy more trades, and each of those trades pays the same fee against a smaller move. Daily bars leave more of the move after costs and let the strategy run without you watching it. Start there, and move to a shorter bar size only when the cost-to-move ratio and your automation both support it.
If you want to discuss bar sizes, costs and automation with other builders, join the free channels on the community page.
We would not trade any strategy described here as-is: it is research only. The figures are measurements on historical data, past performance is not indicative of future results, and nothing in this note is financial advice or a recommendation to buy or sell any instrument.



0 Comments