Backtest 265 evaluates a long-only, daily-bar systematic strategy on a universe of 956 world major-index constituents from 20 January 2016 to 3 October 2025 (≈ 9 years 8 months). Over that window the strategy compounds to a CAGR of 27.6% versus the S&P 500 total-return benchmark at 13.1%, with a max drawdown of -15.55% against the benchmark’s -33.43%.
This is a historical backtest, not a live track record and not a trading signal. Past performance is not indicative of future results. Content is published for informational and educational purposes only – see the closing notes and our community page for the full disclaimer.
Headline numbers
| Metric | Strategy | Benchmark (SPX TR) |
|---|---|---|
| Period | 2016-01-20 → 2025-10-03 | |
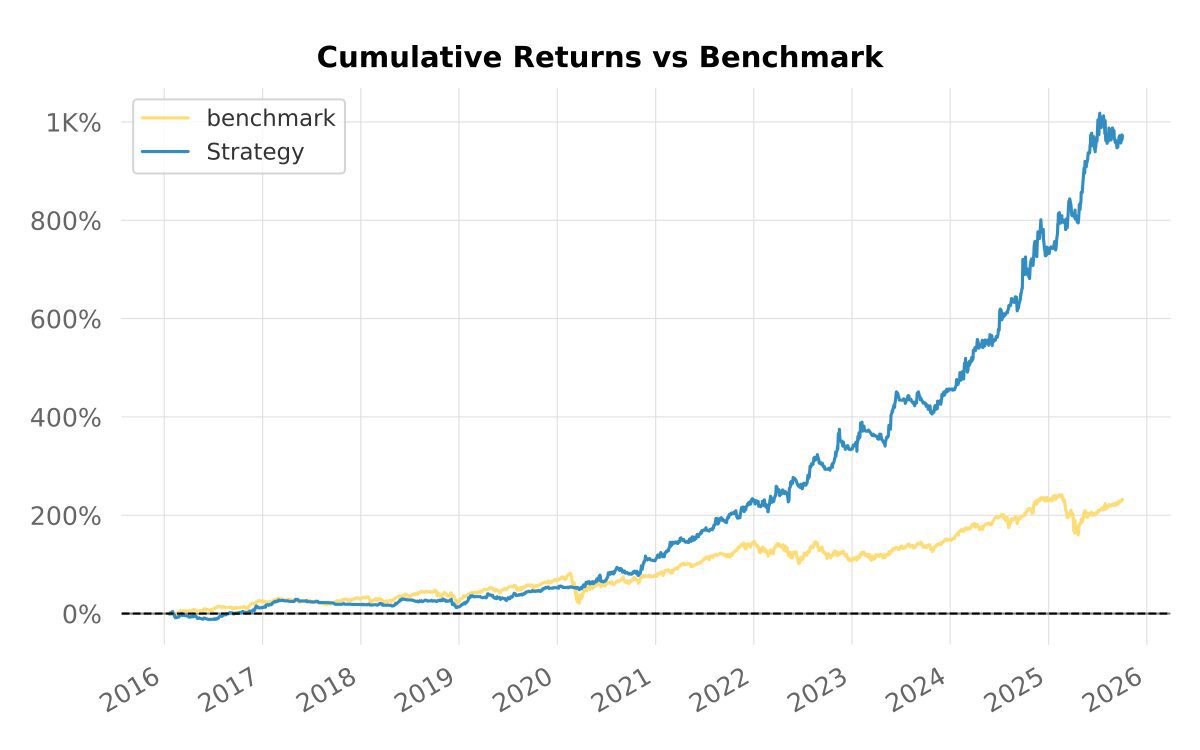
| CAGR | 27.64% | 13.12% |
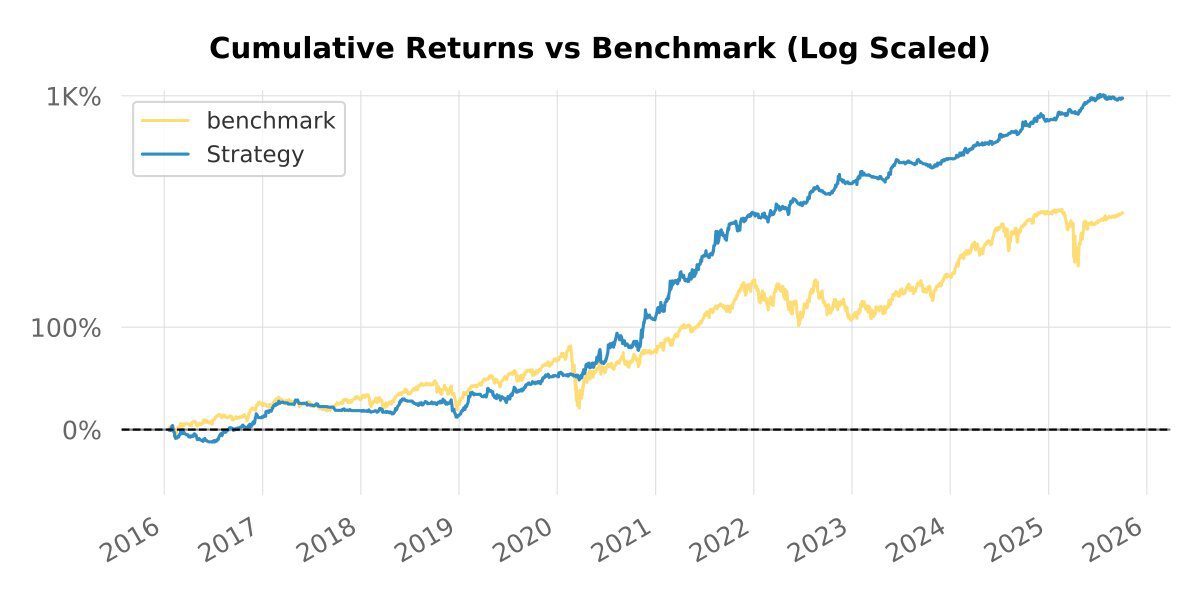
| Cumulative return | +971% | +231% |
| Max drawdown | -15.55% | -33.43% |
| Longest DD (days) | 390 | 475 |
| Volatility (annualised) | 14.85% | 18.82% |
| Sharpe | 0.89 | 0.10 |
| Sortino | 1.39 | 0.13 |
| Calmar | 1.78 | 0.39 |
| Time in market | 91% | 97% |
| Trades | 654 | – |
| Win rate | 49.85% | – |
| Risk / reward | 2.20 | – |
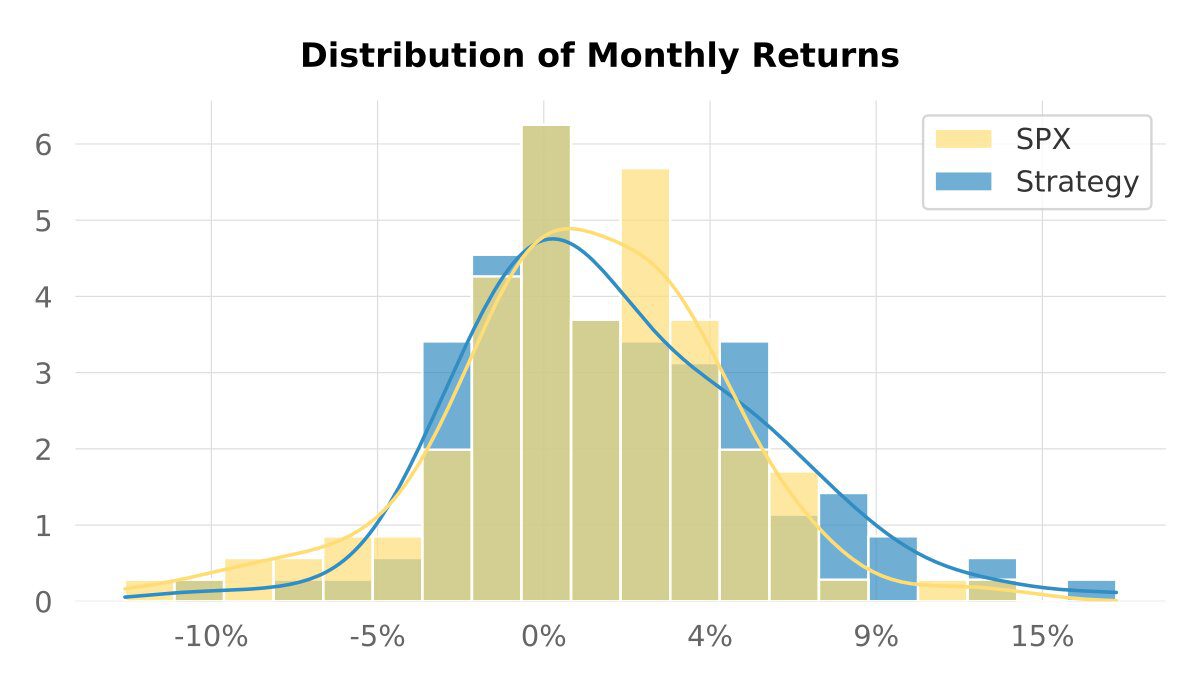
| Skew | +0.48 | -0.37 |
| Kurtosis | 4.09 | 16.44 |
Universe & period
The universe is the major-indices zone – 956 constituents of large world indices, daily bars, denominated in EUR. The simulation warms up indicators from 2014-12-19 and starts compounding from 2016-01-20 with €100,000 of initial capital.
Strategy in plain English
- Long-only, no shorts, no leverage.
- Entry: composite of two Ichimoku-family triggers (internally
ichimoku4a+ichimoku6d). - Exit: a MACD-variant exit rule (
macdv3e) combined with a 22% trailing stop. - Sizing: volatility-targeted at the portfolio level, position cap 20%, sector cap 33%, max 10 new entries per bar.
- Cooldown: a freeze of 2 bars after each exit to avoid immediate re-entries.
- Regime awareness: a 252-bar percentile-based regime filter. Over the test window bars classify as 77% trend, 7% range, 16% bear (see our follow-up null-result study on whether this filter actually improves backtest outcomes) – the strategy is permitted in all three but sizes down outside trend.
Equity curve
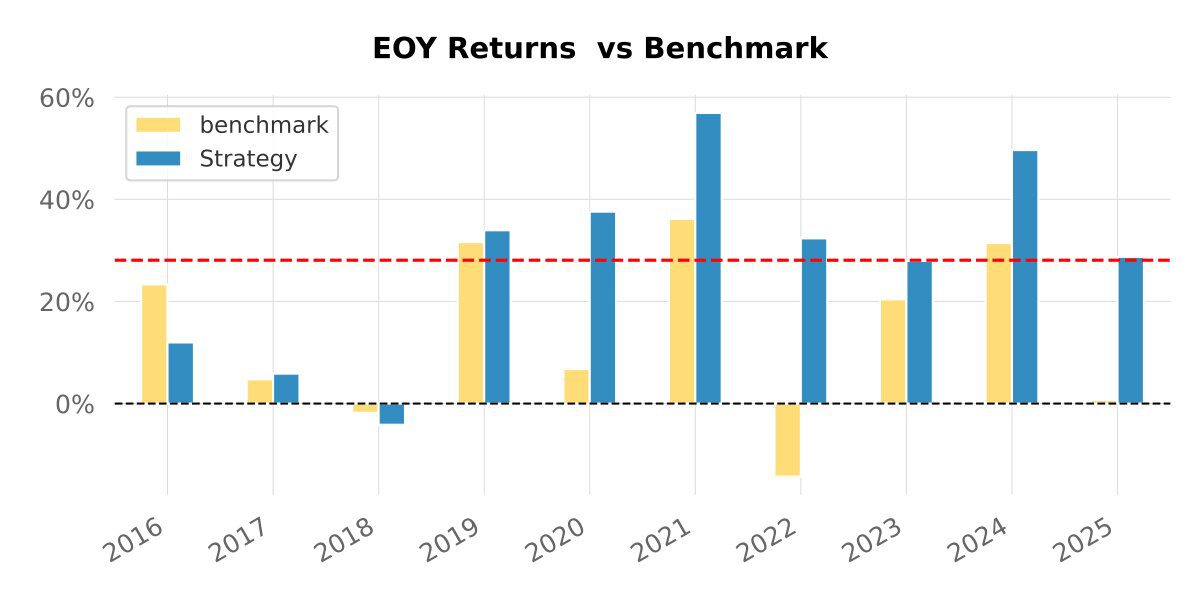
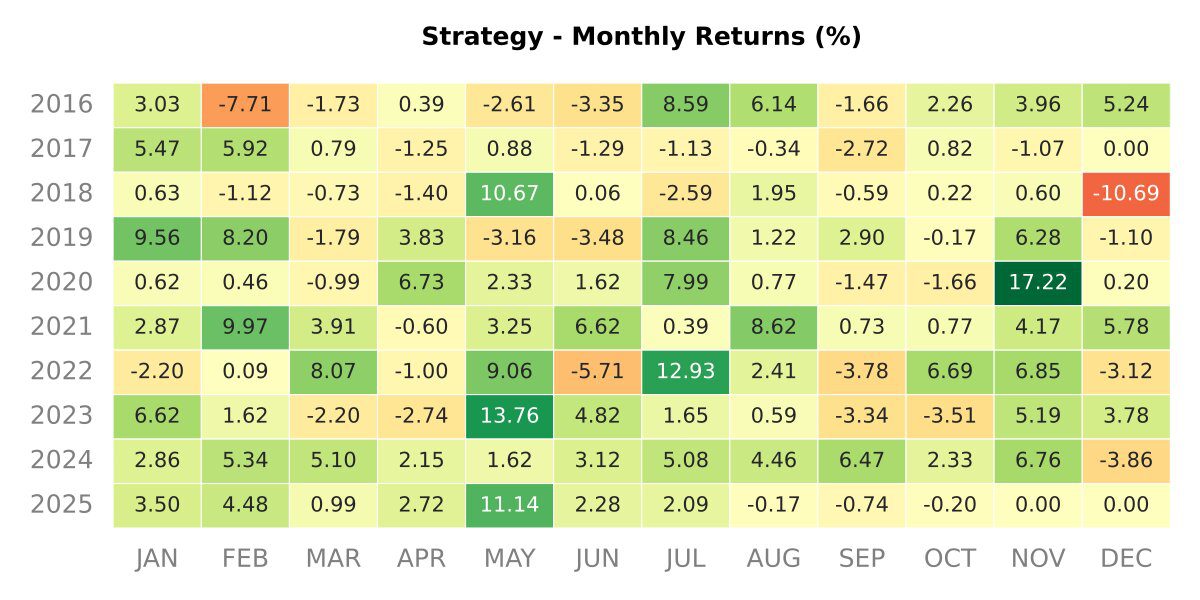
Annual returns
| Year | SPX | Strategy | Multiplier | Won |
|---|---|---|---|---|
| 2016 | 23.33% | 11.97% | 0.51 | – |
| 2017 | 4.76% | 5.86% | 1.23 | + |
| 2018 | -1.80% | -4.15% | 2.30 | – |
| 2019 | 31.62% | 33.94% | 1.07 | + |
| 2020 | 6.76% | 37.58% | 5.56 | + |
| 2021 | 36.18% | 56.91% | 1.57 | + |
| 2022 | -14.32% | 32.35% | -2.26 | + |
| 2023 | 20.42% | 27.94% | 1.37 | + |
| 2024 | 31.43% | 49.64% | 1.58 | + |
| 2025 | 0.69% | 28.73% | 41.42 | + |
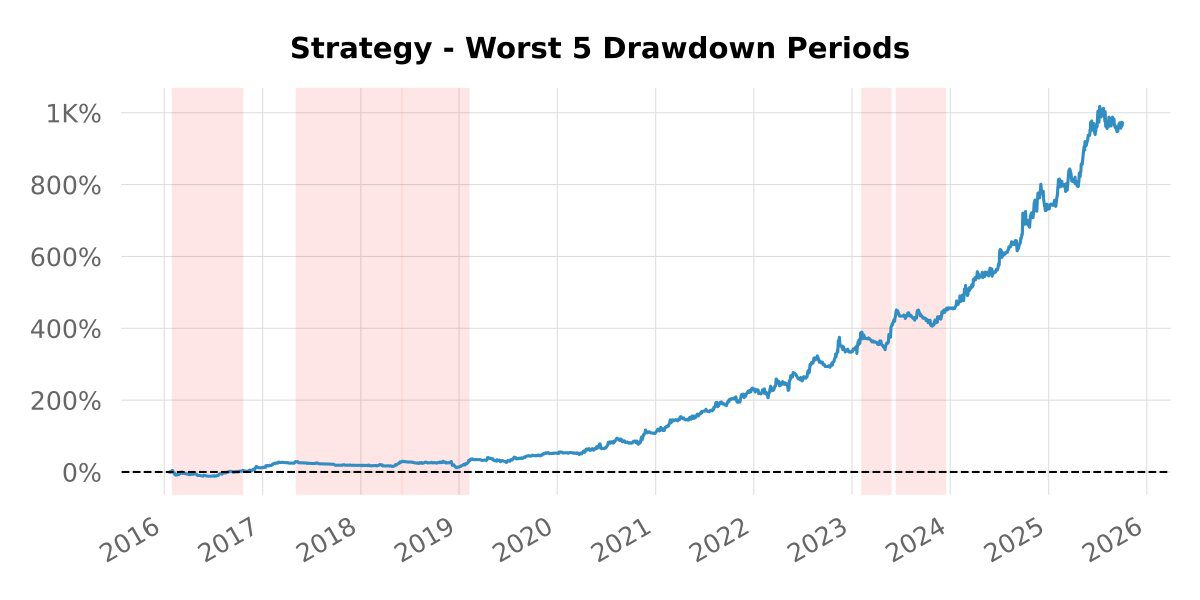
Drawdown analysis
The deepest drawdown sits at -15.55%, taken early in the period (Feb-Oct 2016). After 2018 no single drawdown exceeds -14%, and the largest 2020 COVID drawdown was -8.6% – versus -33% for SPX over the same window.
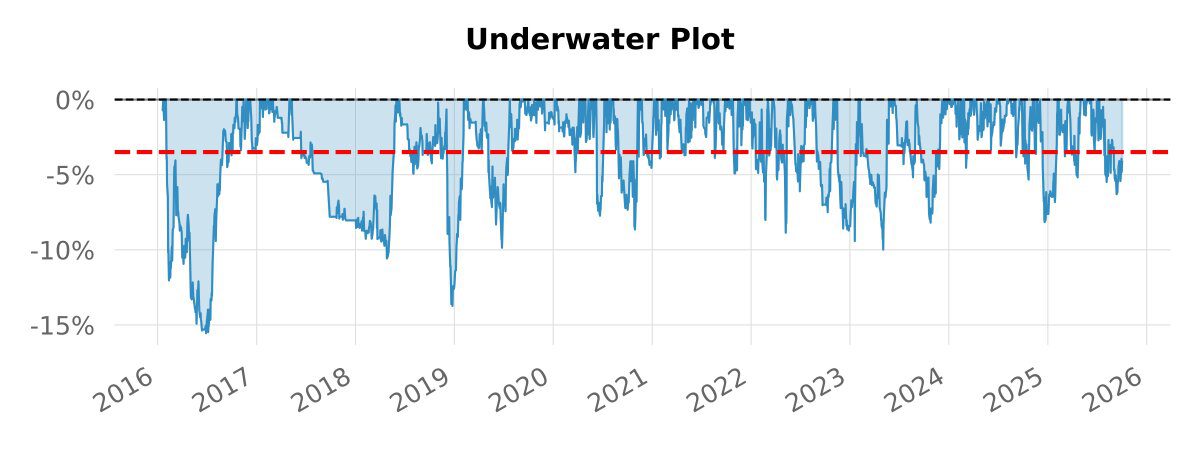
| Started | Recovered | Drawdown | Days |
|---|---|---|---|
| 2016-02-02 | 2016-10-17 | -15.55% | 259 |
| 2018-06-05 | 2019-02-05 | -13.73% | 246 |
| 2017-05-08 | 2018-06-01 | -10.58% | 390 |
| 2023-02-08 | 2023-05-24 | -9.99% | 106 |
| 2019-04-22 | 2019-07-24 | -9.86% | 94 |
| 2022-11-16 | 2023-02-01 | -9.42% | 78 |
| 2022-03-28 | 2022-05-16 | -8.86% | 50 |
| 2020-08-11 | 2020-11-06 | -8.64% | 88 |
| 2023-06-16 | 2023-12-13 | -8.19% | 181 |
| 2024-12-04 | 2025-02-05 | -8.15% | 64 |
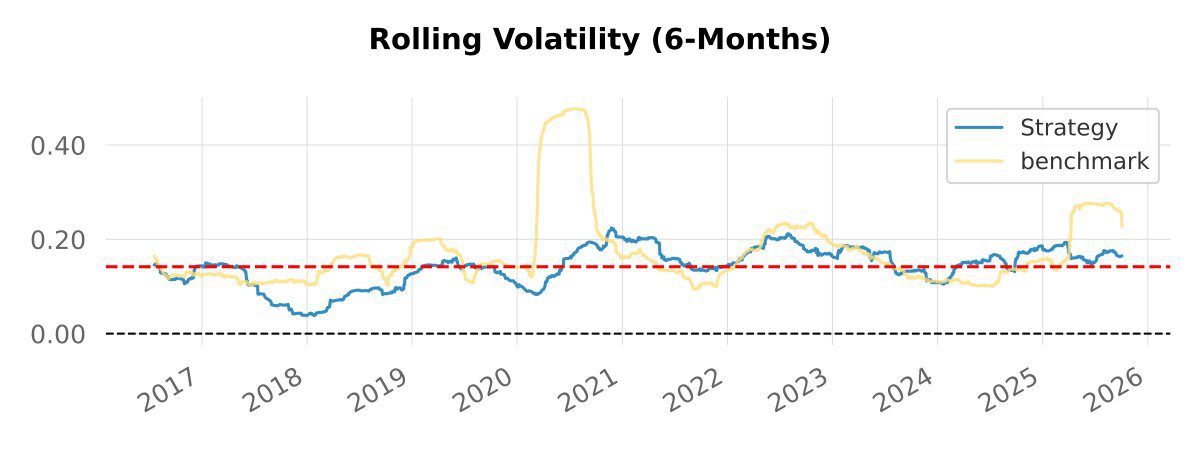
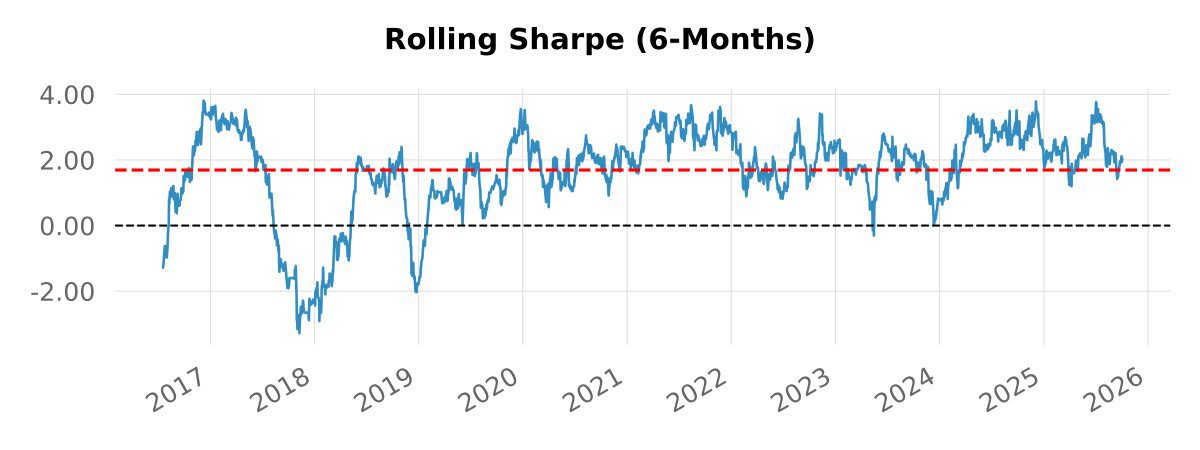
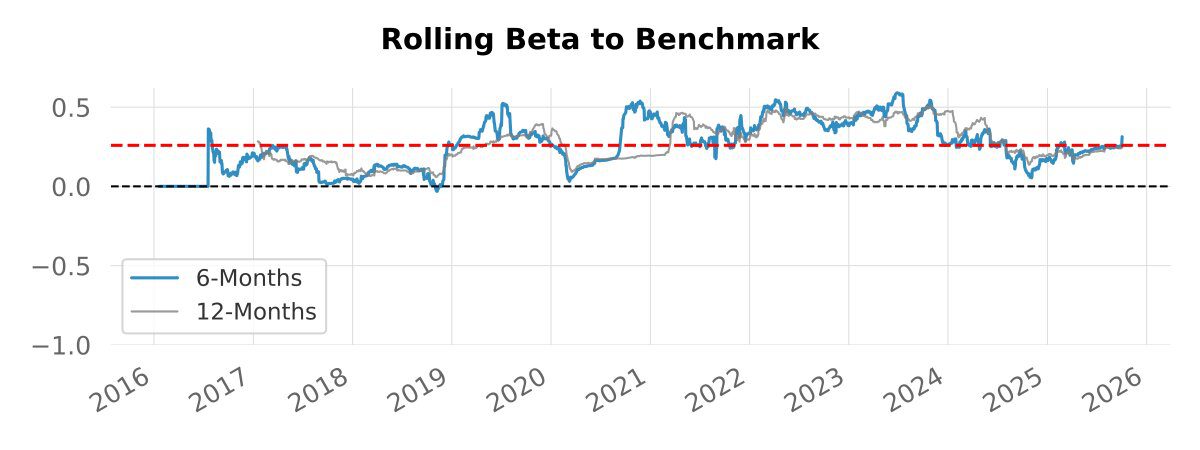
Rolling metrics
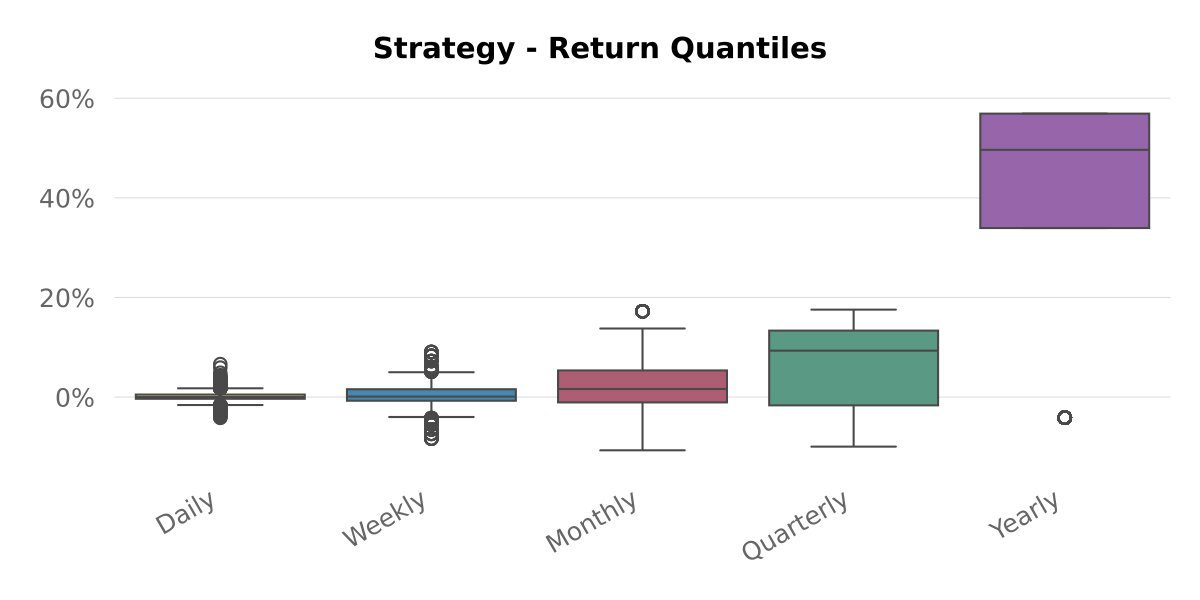
Return distribution
Caveats & reading guide
- This is a backtest, not a live track record. Trades are simulated on historical daily bars; real-world execution would face additional slippage, partial fills, and venue-specific frictions.
- Survivorship. The universe is built from current and historical major-index constituents; while care is taken to include delisted names, residual survivorship bias cannot be ruled out.
- Risk-free rate. The QuantStats report uses an annual RF of 13.1% (inherited from a high-rate working assumption), which mechanically suppresses the printed Sharpe. An RF-flat internal calculation reports Sharpe 0.98 and Sortino 1.10 over the same window.
- Costs. Transaction costs are modelled at the bar level; the strategy turns over ~65 trades per year on average.
- Out-of-sample. Parameter selection used the early portion of the window; results from 2020 onward give a more honest read of out-of-sample behaviour.
Discuss this backtest
We share backtest research, methodology notes and discussion on our free community channels – Telegram, Discord, X. Full details and the bilingual disclaimer on the community page.
KreamEdge publishes systematic strategy backtests and market analytics for informational and educational purposes only – not personalised investment advice. Past performance is not indicative of future results.
0 Comments