Backtest 308 evaluates a long-only, daily-bar systematic strategy on a universe of 1,006 world major-index constituents – now including KOSPI 50 (Korea) large caps – from 8 February 2016 to 30 April 2026 (≈ 10 years 3 months). Over that window the strategy compounds to a CAGR of 32.7% versus the S&P 500 total-return benchmark at 14.2%, with a max drawdown of -14.36% against the benchmark’s -33.92%. This run also re-bases the accounting currency from CHF to USD.
This is a historical backtest, not a live track record and not a trading signal. Past performance is not indicative of future results. Content is published for informational and educational purposes only – see the closing notes and our community page for the full disclaimer.
Headline numbers
| Metric | Strategy | Benchmark (SPX TR) |
|---|---|---|
| Period | 2016-02-08 → 2026-04-30 | |
| CAGR | 32.72% | 14.19% |
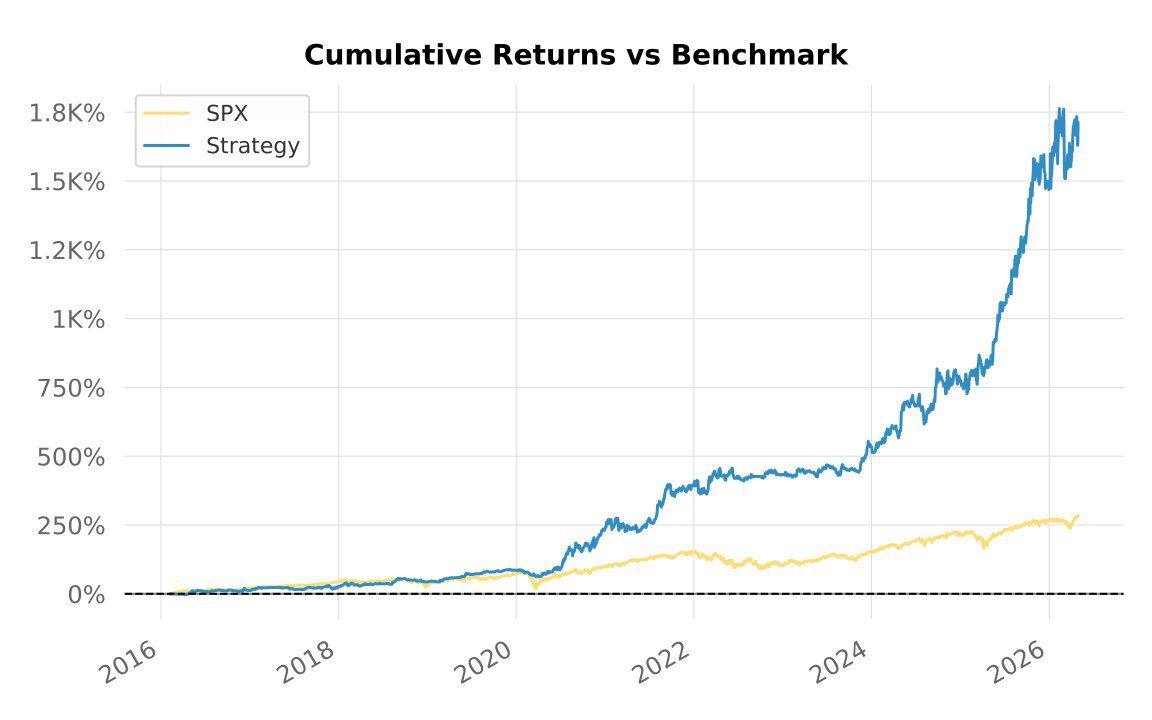
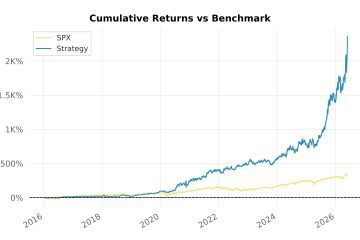
| Cumulative return | +1,712% | +289% |
| Max drawdown | -14.36% | -33.92% |
| Longest DD (days) | 371 | 745 |
| Volatility (annualised) | 19.40% | 17.94% |
| Sharpe | 0.89 | 0.10 |
| Sortino | 1.30 | 0.14 |
| Calmar | 2.28 | 0.42 |
| Time in market | 95% | 97% |
| Beta to SPX | 0.24 | – |
| Trades | 966 | – |
| Win rate | 49.48% | – |
| Risk / reward | 1.71 | – |
| Skew | -0.26 | -0.38 |
| Kurtosis | 7.28 | 16.64 |
What changed since backtest 265
This report follows our previous world-indices study, Backtest 265. Two things changed on the data side:
- Universe expanded with KOSPI 50. The major-indices zone now carries Korean large-cap constituents, taking the symbol count to 1,006. A broader cross-section gives the ranking logic more candidates per bar, but it also means this is not an apples-to-apples re-run of 265 – the opportunity set is different.
- Base currency switched CHF → USD. The portfolio is now denominated, financed and reported in USD. This is primarily an accounting / FX-translation change (cash, borrow accrual and the equity curve are all in USD); it is not a change to the entry or exit logic. Read the headline CAGR with that in mind – part of any difference versus 265 is FX and universe, not signal alpha.
The entry/exit rules in this run (MACD-variant entry, Ichimoku + Parabolic-SAR exit – see below) also differ from 265’s configuration, so treat 308 as its own backtest rather than a like-for-like delta on 265.
Universe & period
The universe is the major-indices zone – 1,006 constituents of large world indices (now including KOSPI 50), daily bars, denominated in USD. The simulation warms up indicators from 2014-12-19 and starts compounding from 2016-02-08 with $100,000 of initial capital, ending 2026-04-30.
Strategy in plain English
- Long-only, no shorts, no leverage (gross exposure averages ~50%).
- Entry: a MACD-variant trigger (internally
macdv1b). - Exit: a composite of Ichimoku and Parabolic-SAR rules (internally
ichimoku6a+psar0a), combined with a 28% trailing stop. - Sizing: volatility-targeted at the portfolio level, position cap 20%, sector cap 33%, max 10 new entries per bar.
- Cooldown: a freeze of 2 bars after each exit to avoid immediate re-entries.
- Regime awareness: a 252-bar percentile-based regime filter. Over the test window bars classify as ~78% trend, ~8% range, ~15% bear (see our follow-up null-result study on whether this filter actually improves backtest outcomes) – the strategy is permitted in all three but sizes down outside trend.
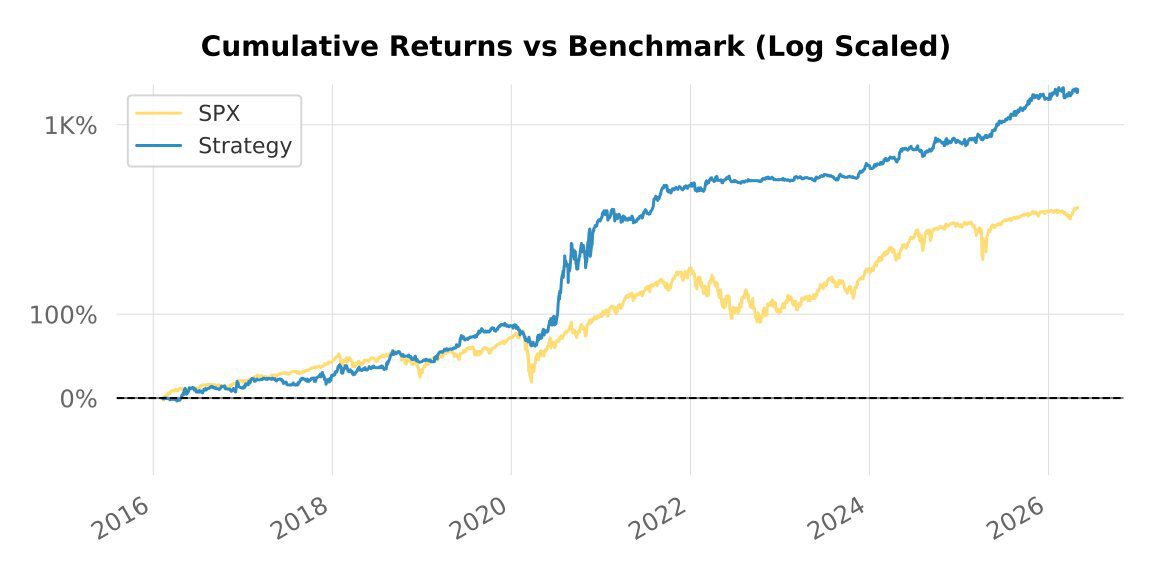
Equity curve
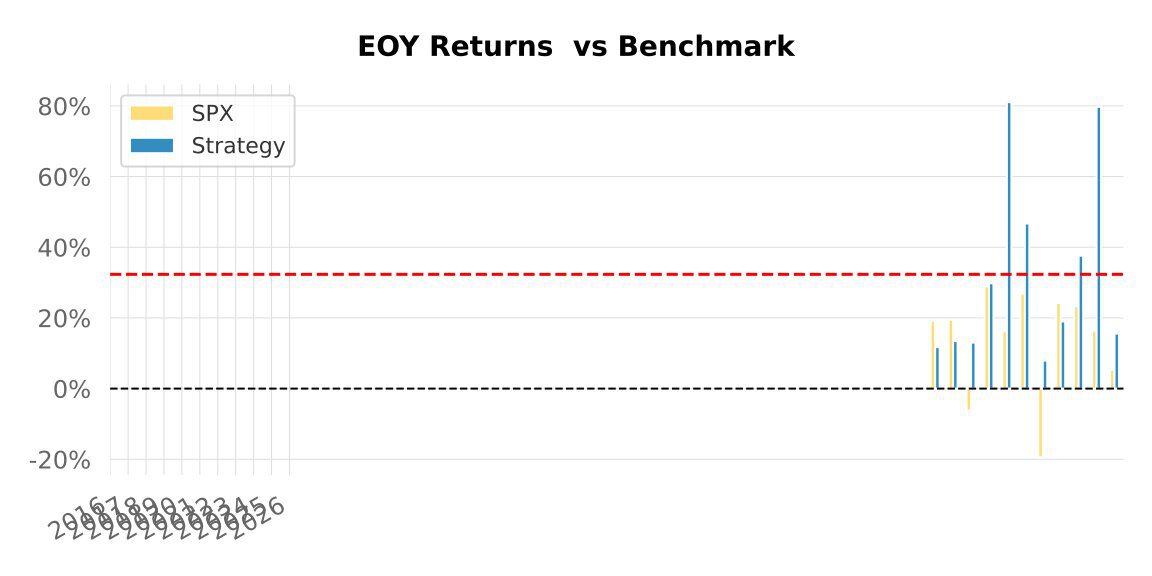
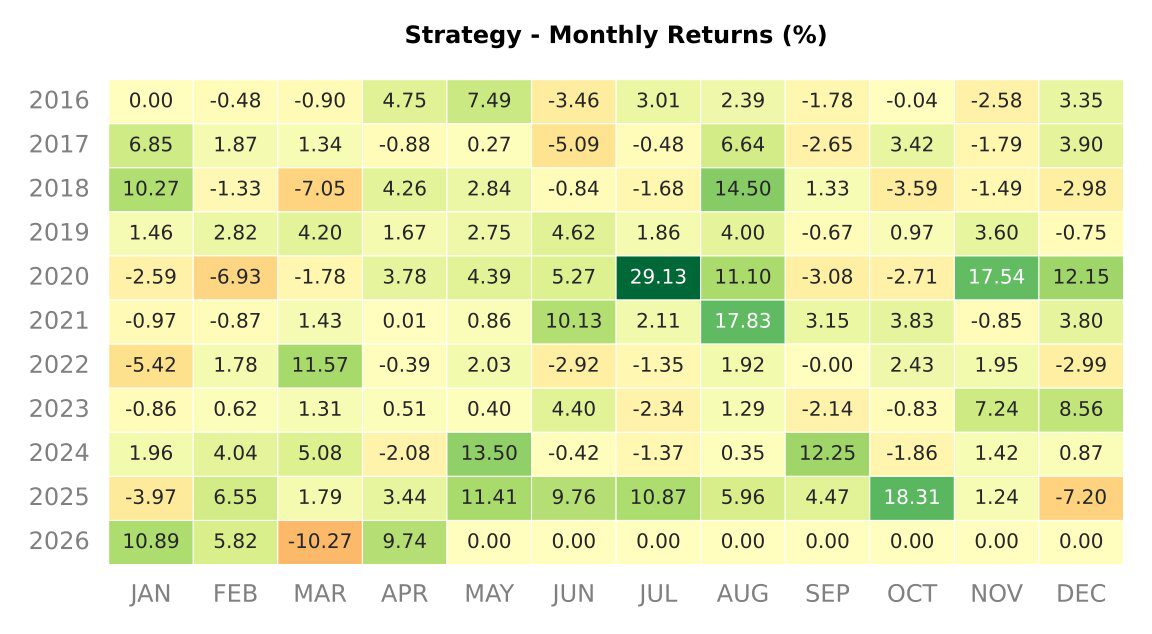
Annual returns
| Year | SPX | Strategy | Multiplier | Won |
|---|---|---|---|---|
| 2016 | 19.08% | 11.75% | 0.62 | – |
| 2017 | 19.42% | 13.44% | 0.69 | – |
| 2018 | -6.24% | 13.02% | -2.09 | + |
| 2019 | 28.88% | 29.80% | 1.03 | + |
| 2020 | 16.26% | 81.06% | 4.99 | + |
| 2021 | 26.89% | 46.70% | 1.74 | + |
| 2022 | -19.44% | 7.91% | -0.41 | + |
| 2023 | 24.23% | 18.99% | 0.78 | – |
| 2024 | 23.31% | 37.60% | 1.61 | + |
| 2025 | 16.39% | 79.72% | 4.86 | + |
| 2026* | 5.31% | 15.54% | 2.93 | + |
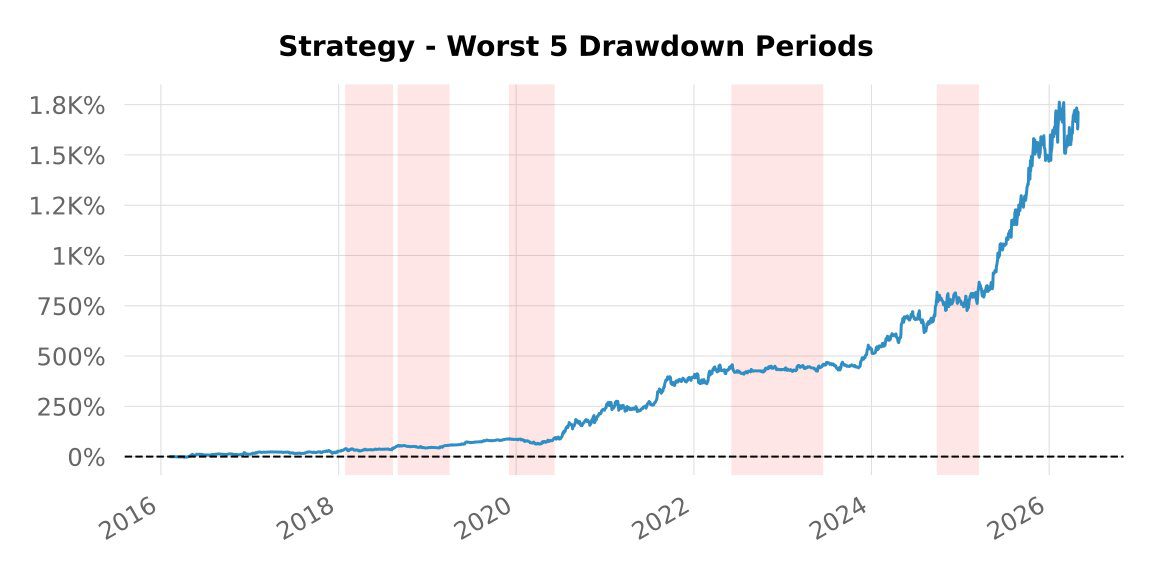
Drawdown analysis
The deepest drawdown sits at -14.36%, spanning the COVID window (Dec 2019 – Jun 2020). No single drawdown in the record exceeds -15%, and the strategy spends most of its time within a few percent of its high-water mark – versus -33.92% peak-to-trough for SPX over the same window. Note the third-worst drawdown (-13.64%, starting 2026-02-13) was still open at the end of the sample on 30 April 2026; its “recovered” date is simply the last bar, not a true recovery.
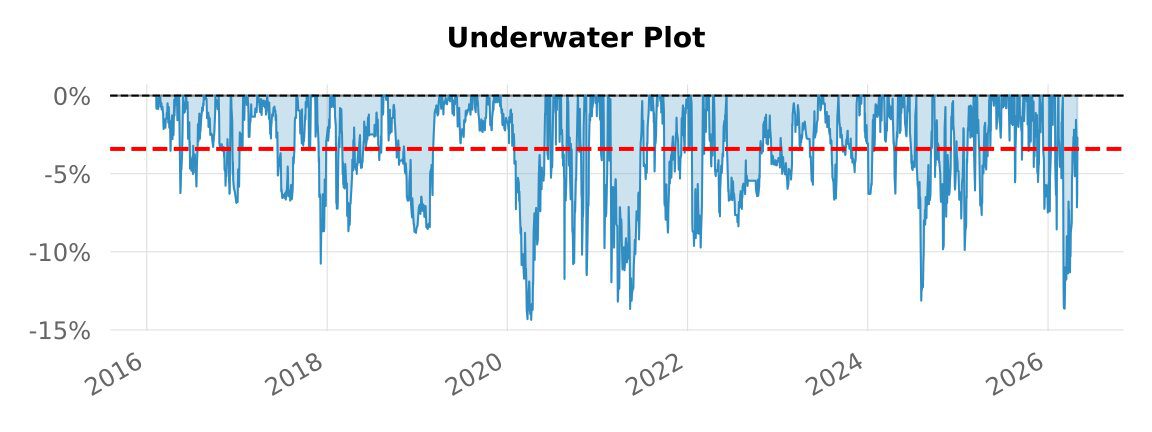
| Started | Recovered | Drawdown | Days |
|---|---|---|---|
| 2019-12-06 | 2020-06-03 | -14.36% | 181 |
| 2021-02-17 | 2021-07-29 | -13.66% | 163 |
| 2026-02-13 | (open) | -13.64% | 77 |
| 2024-07-17 | 2024-09-18 | -13.13% | 64 |
| 2020-08-07 | 2020-08-28 | -11.74% | 22 |
| 2020-11-17 | 2020-12-02 | -11.49% | 16 |
| 2020-09-03 | 2020-11-06 | -10.79% | 65 |
| 2017-11-22 | 2018-01-11 | -10.76% | 51 |
| 2024-09-30 | 2025-03-14 | -9.89% | 166 |
| 2021-01-26 | 2021-02-11 | -9.77% | 17 |
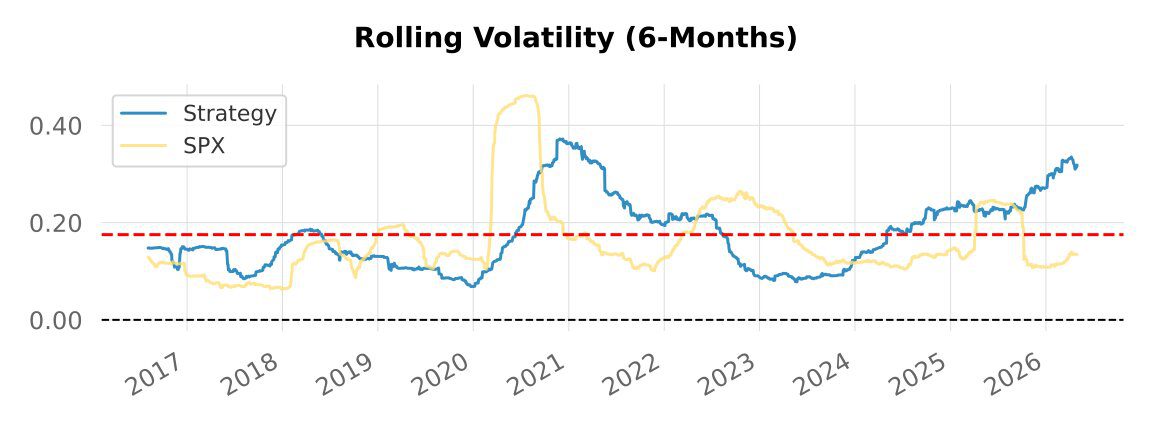
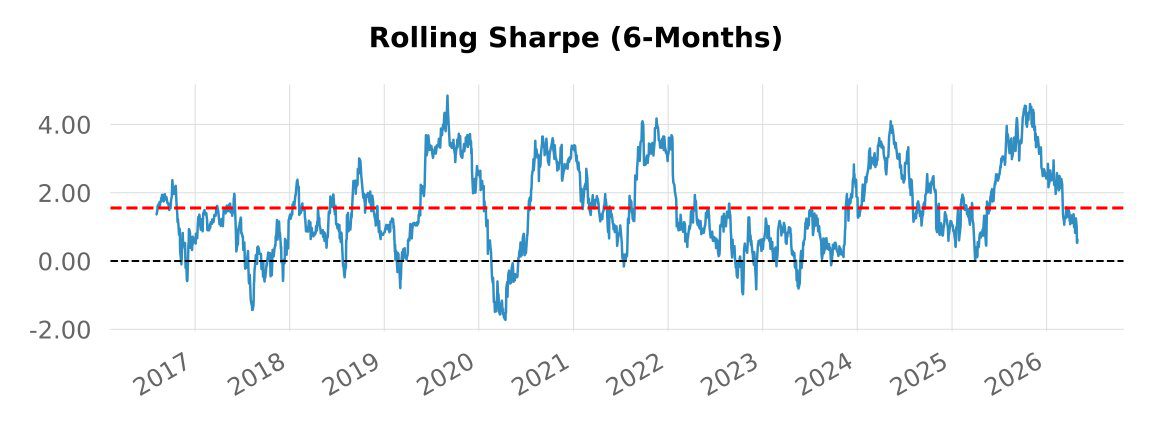
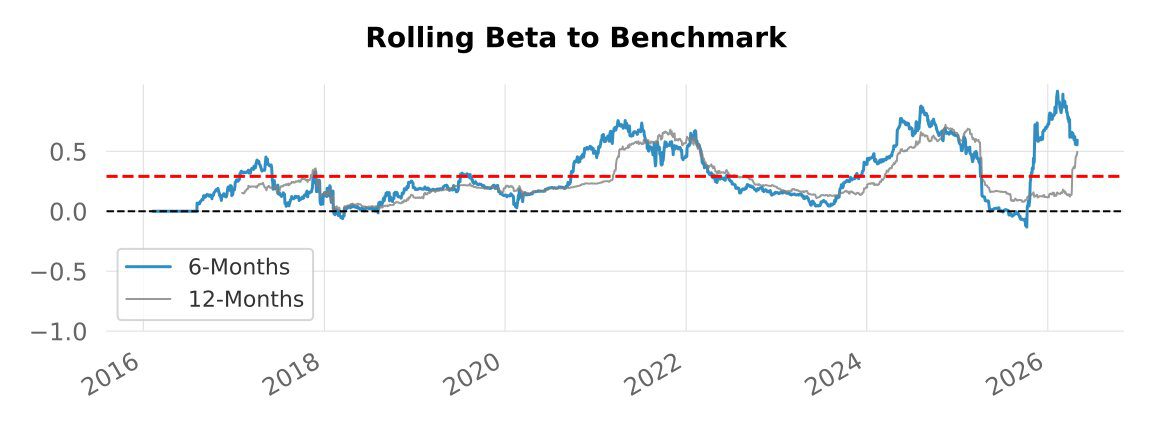
Rolling metrics
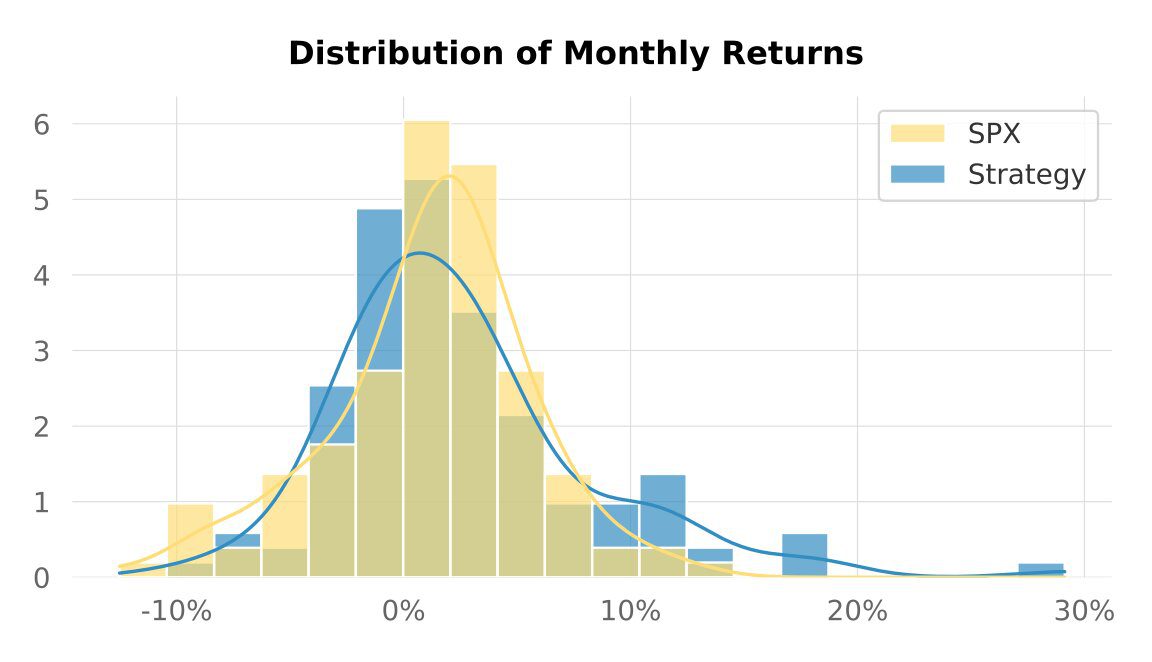
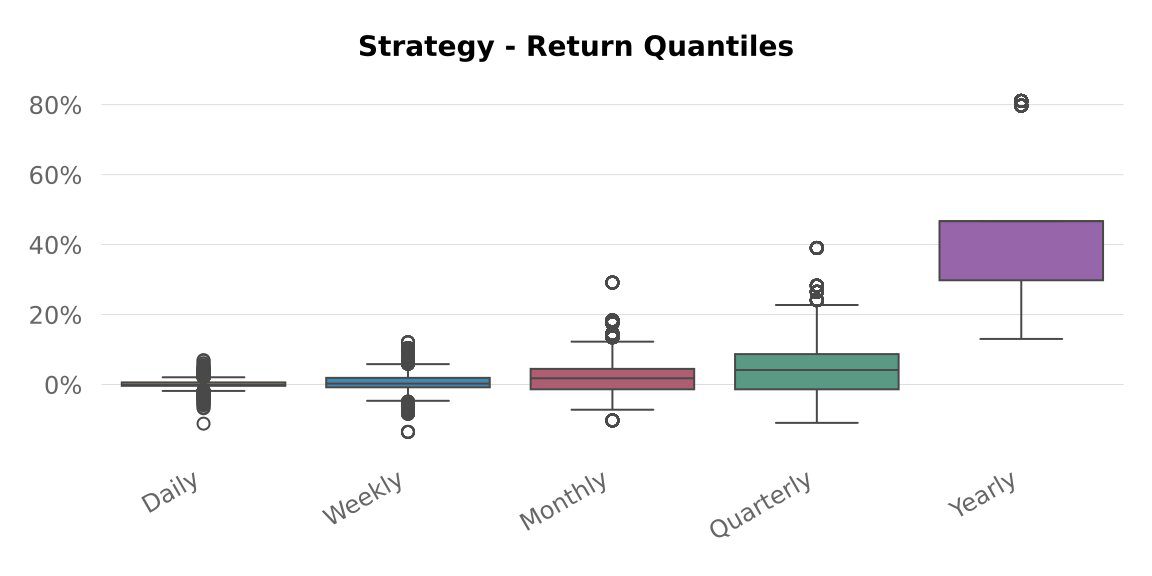
Return distribution
Caveats & reading guide
- This is a backtest, not a live track record. Trades are simulated on historical daily bars; real-world execution would face additional slippage, partial fills, and venue-specific frictions.
- Universe changed mid-lineage. Adding KOSPI 50 means the cross-section differs from earlier world-indices runs; do not read the CAGR as a clean improvement over 265.
- Base-currency / FX. Results are in USD. The CHF → USD switch moves cash, borrow accrual and the reported equity curve into USD and therefore embeds USD/foreign FX moves into the headline numbers.
- Survivorship. The universe is built from current and historical major-index constituents; while care is taken to include delisted names, residual survivorship bias cannot be ruled out.
- Risk-free rate. The QuantStats report uses a high annual RF (13.9%, inherited from a working assumption), which mechanically suppresses the printed Sharpe. An RF-flat internal calculation reports Sharpe 0.96, Sortino 1.08 and Calmar 2.26 over the same window.
- Costs. Transaction costs, a value-traded borrow-fee model (0.8%) and a 1.5% margin spread are modelled at the bar level; the strategy turns over ~95 trades per year on average (966 total).
- Out-of-sample. Parameter selection used the early portion of the window; results from 2020 onward give a more honest read of out-of-sample behaviour. The open -13.6% drawdown into April 2026 is a reminder that recent bars are not yet resolved. Hard cutoff: the strategy’s rules and parameters were frozen on 3 July 2025, so all performance after that date is genuine out-of-sample / forward-tracked data – unseen at selection time, with no hindsight possible.
Discuss this backtest
We share backtest research, methodology notes and discussion on our free community channels – Telegram, Discord, X. Full details and the bilingual disclaimer on the community page.
KreamEdge publishes systematic strategy backtests and market analytics for informational and educational purposes only – not personalised investment advice. Past performance is not indicative of future results.

0 Comments