Backtest 332 combines two systematic 1D strategies we have already published – the US-equities book from Backtest 317 and the world-major-indices (incl. KOSPI 50) book from Backtest 308 – into a single portfolio that runs both rule sets on one shared cash account. Over the matched window 13 January 2016 – 29 May 2026, benchmarked against the S&P 500 (SPX), the blended book produced a 34.84% CAGR against the index’s 14.94%, with a −27.13% maximum drawdown versus the SPX’s −33.92%. Risk-adjusted, it reports a Sharpe of 1.48 and a Sortino of 2.10 (risk-free rate set to 0% in this report). The headline trade-off is the whole point of the exercise: pooling the two books lifted both the return and the Sharpe above either sleeve on its own, but the maximum drawdown is deeper than either ran standalone.
This is a backtest, published for informational and educational purposes only. It is not financial advice, not a recommendation to buy or sell any asset, and not an offer of any managed product. Past simulated performance does not guarantee future results.
Headline numbers
| Metric | Combined strategy | SPX benchmark |
|---|---|---|
| CAGR | 34.84% | 14.94% |
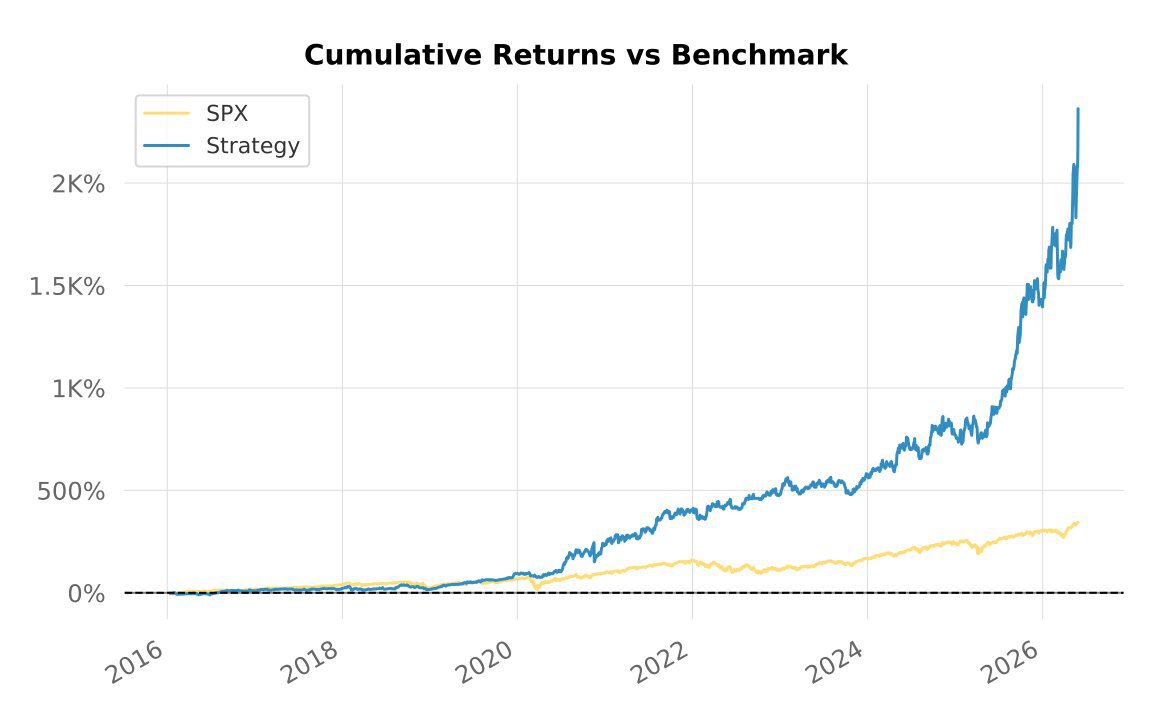
| Cumulative return | 2,363.35% | 344.92% |
| Max drawdown | −27.13% | −33.92% |
| Longest drawdown (days) | 206 | 704 |
| Volatility (ann.) | 21.94% | 17.82% |
| Sharpe (RF 0%) | 1.48 | 0.87 |
| Sortino | 2.10 | 1.23 |
| Calmar | 1.28 | 0.44 |
| Time in market | 99.0% | 100.0% |
| Beta to SPX | 0.37 | – |
| Correlation to SPX | 30.33% | – |
| Skew | −2.49 | −0.39 |
| Kurtosis | 52.4 | 15.79 |
| Trades (portfolio sim) | 2,810 | – |
| Win rate | 47.3% | – |
| Risk-reward (avg win / avg loss) | 1.20 | – |
| Avg. gross exposure | ~77% | – |
How the two backtests are combined
Both parent strategies are long-only, no-shorts, no-leverage systematic daily books, and they share the same risk-control chassis: portfolio-level volatility targeting, a 20% per-position cap, a 33% sector cap, a maximum of 10 new entries per bar, a 2-bar freeze after each exit, and a 252-bar percentile regime filter (≈78% trend / 8% range / 15% bear over this window – note this mix is benchmark/VIX-percentile driven, so it is the same across all our reports on this range, not a universe-specific result). What differs is the universe and the entry/exit rule family:
- Sleeve A – Backtest 317 (US equities): a MACD-variant entry, a moving-average plus VIX-based exit, 14% trailing stop; 4,176 US-listed names. Standalone: CAGR 30.41%, MaxDD −17.70%.
- Sleeve B – Backtest 308 (world indices + KOSPI 50): a MACD-variant entry, an Ichimoku plus Parabolic-SAR exit, 28% trailing stop; 1,006 world-index constituents. Standalone: CAGR 32.72%, MaxDD −14.36%.
“Combined” here means a shared-cash aggregate: both rule sets draw entries from one cash account rather than from two separate books. That shared pool is why average gross exposure rises to roughly 77% (versus ≈50% for the standalone world-index sleeve) – and why the blended drawdown behaviour is not the same as a naïve 50/50 average of the two equity curves. The two books can crowd into the same risk at the same time.
Universe & period
- Combined universe: ~5,182 names – 4,176 US-listed equities plus 1,006 world-index constituents (incl. KOSPI 50), USD-denominated, daily bars.
- Matched reporting window: 13 January 2016 – 29 May 2026 (~10.4 years), with each sleeve warming up from earlier data.
- Benchmark: S&P 500 price index (SPX), USD.
Strategy in plain English
- Direction: long-only, no shorts, no leverage, on both sleeves.
- Entries: a MACD-variant trigger on each sleeve – on US equities and world indices.
- Exits: sleeve A uses a moving-average rule plus a VIX-based filter with a 14% trailing stop; sleeve B uses Ichimoku plus Parabolic-SAR rules with a 28% trailing stop.
- Sizing: volatility-targeted at portfolio level, 20% position cap, 33% sector cap, max 10 new entries per bar – shared across the combined book.
- Cooldown: a 2-bar freeze after each exit to avoid immediate re-entries.
- Regime awareness: a 252-bar percentile-based filter that permits trades in all regimes but sizes down outside trend.
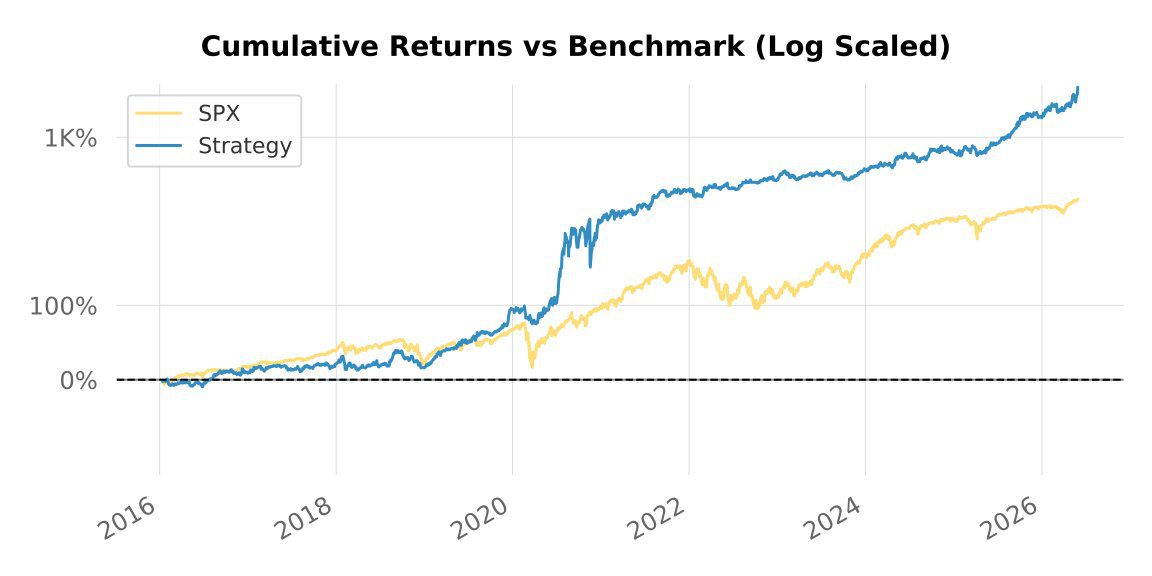
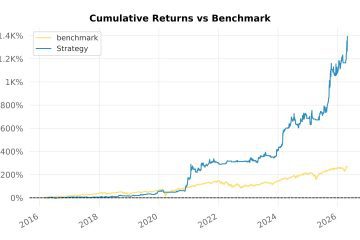
Equity curve
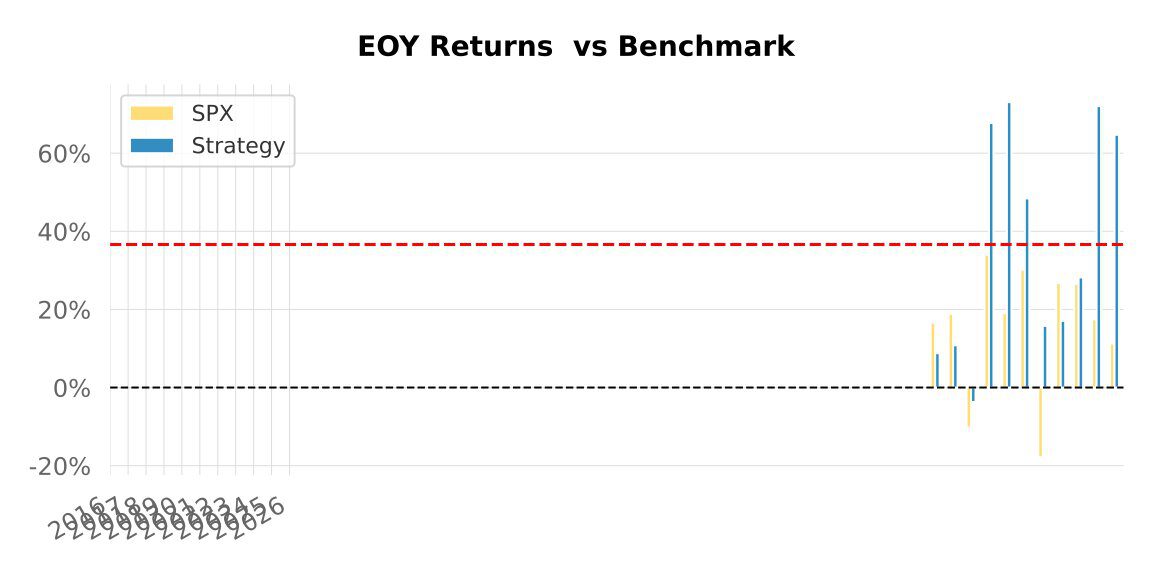
Annual returns
| Year | SPX | Combined strategy | Won vs SPX |
|---|---|---|---|
| 2016 | 16.60% | 8.80% | – |
| 2017 | 18.88% | 10.81% | – |
| 2018 | −10.25% | −3.70% | + |
| 2019 | 34.02% | 67.73% | + |
| 2020 | 19.05% | 73.07% | + |
| 2021 | 30.19% | 48.42% | + |
| 2022 | −17.86% | 15.78% | + |
| 2023 | 26.77% | 17.08% | – |
| 2024 | 26.56% | 28.20% | + |
| 2025 | 17.45% | 72.04% | + |
| 2026* | 11.25% | 64.71% | + |
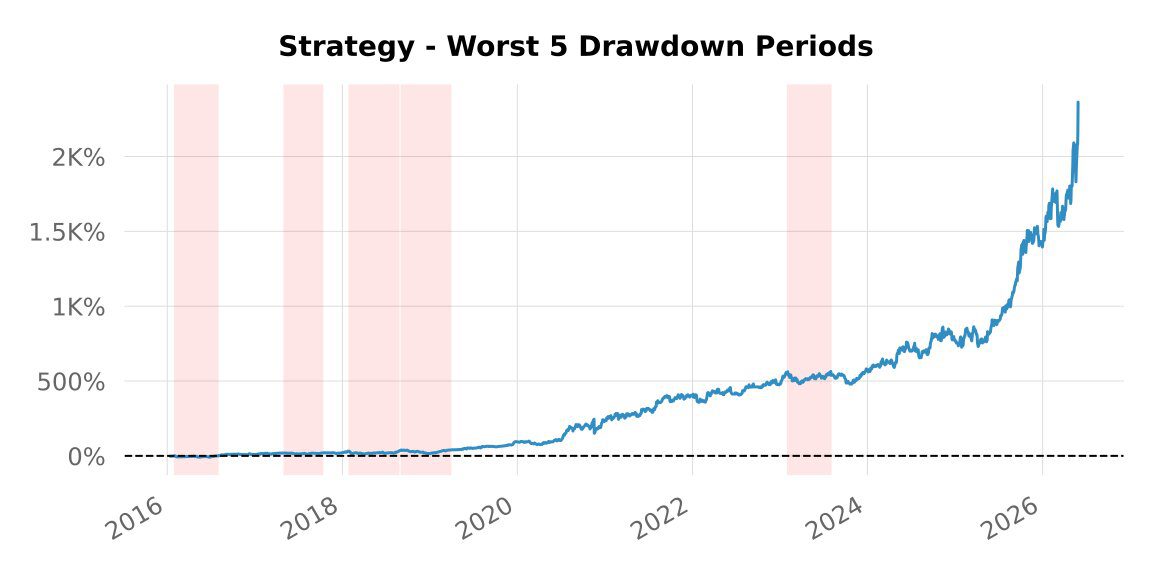
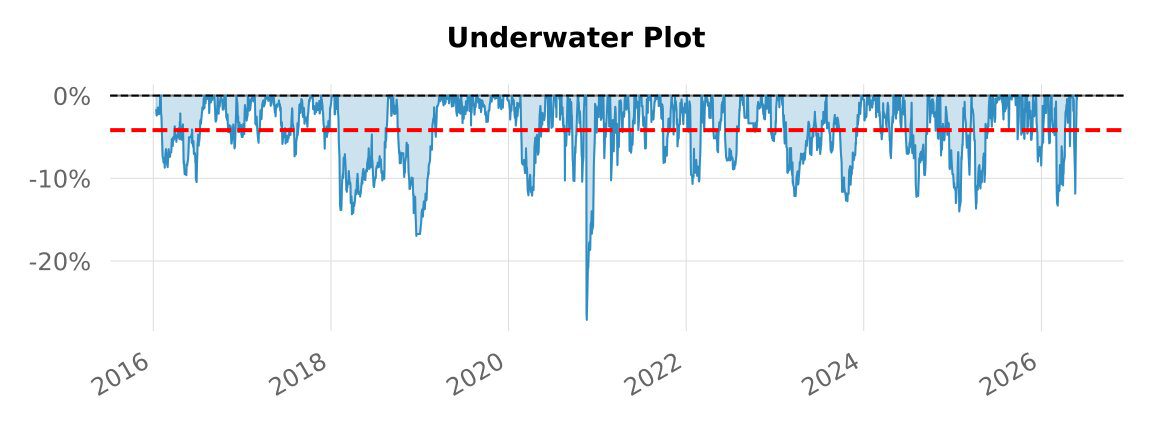
Drawdown analysis
This is the most important section to read carefully. The combined book’s −27.13% maximum drawdown is deeper than either standalone sleeve (317: −17.70%, 308: −14.36%), and it is almost entirely a single event: a −26.42% worst day on 17-18 November 2020, when both long-only books de-risked into the same momentum-to-value rotation. The shared cash pool meant the two sleeves were exposed together, so diversification across the two universes did not cushion that shock. The flip side is that the recovery was fast – 51 days back to high-water – and the underwater plot below shows it as a lone sharp spike against otherwise shallow drawdowns. None of the worst-10 drawdowns is still open at the end of the window.
| Started | Recovered | Drawdown | Days |
|---|---|---|---|
| 2020-11-17 | 2021-01-06 | −27.13% | 51 |
| 2018-09-05 | 2019-03-28 | −16.97% | 205 |
| 2018-01-30 | 2018-08-23 | −14.36% | 206 |
| 2024-11-12 | 2025-03-18 | −14.02% | 127 |
| 2025-03-21 | 2025-05-30 | −13.67% | 71 |
| 2026-02-13 | 2026-04-23 | −13.31% | 70 |
| 2023-08-02 | 2023-12-22 | −12.79% | 143 |
| 2024-06-13 | 2024-09-20 | −12.24% | 100 |
| 2023-02-03 | 2023-07-31 | −12.16% | 179 |
| 2020-02-20 | 2020-05-29 | −12.10% | 100 |
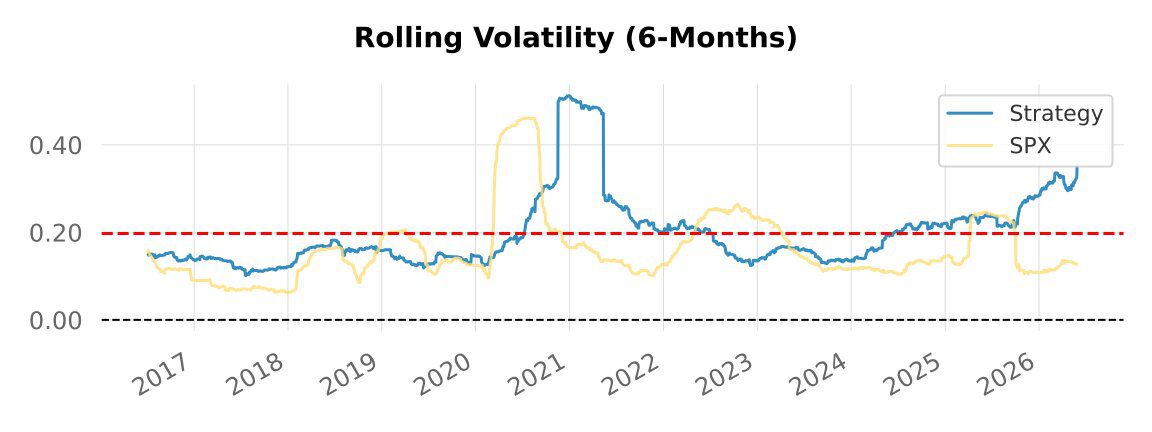
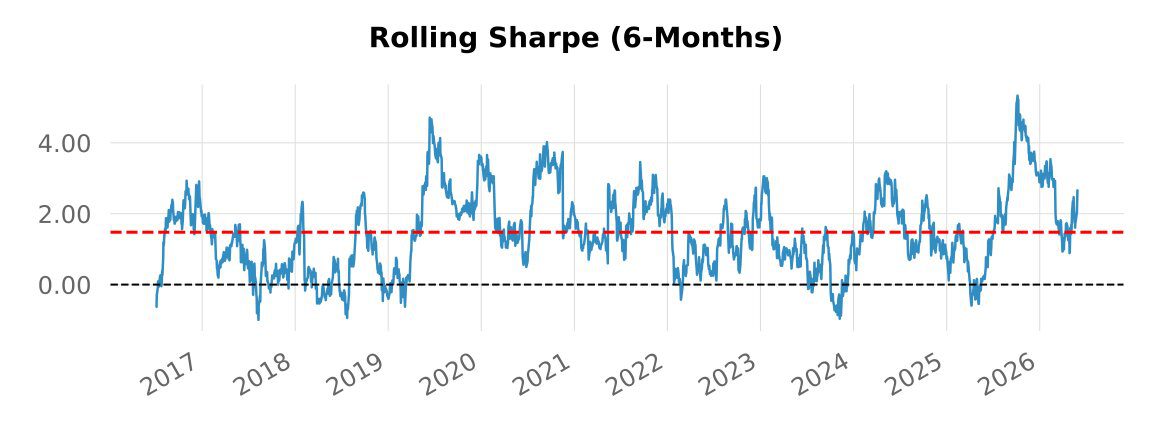
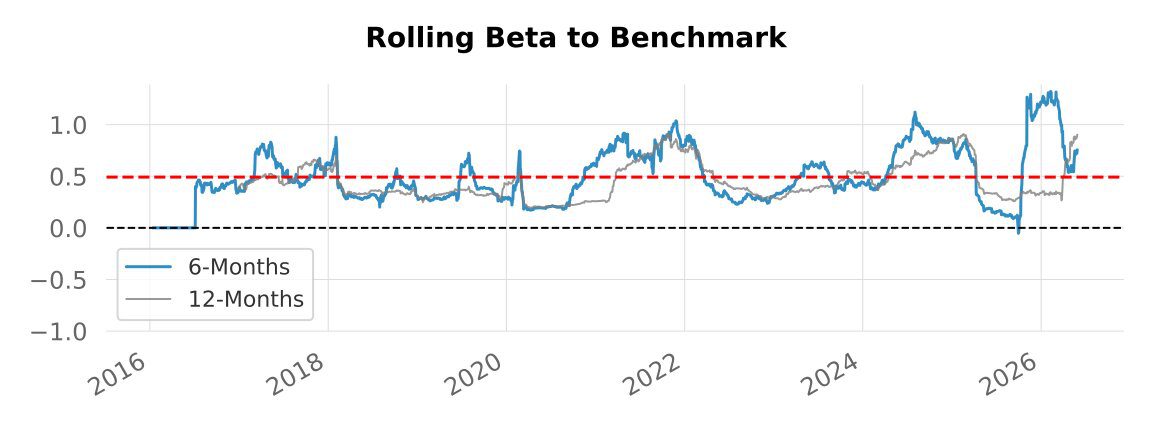
Rolling metrics
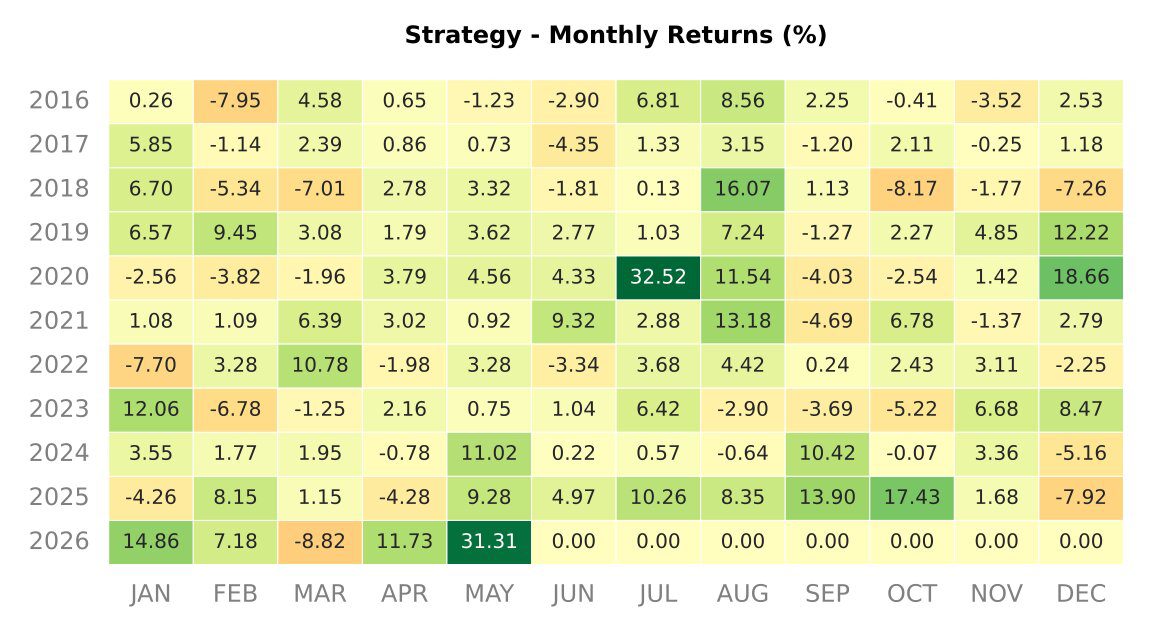
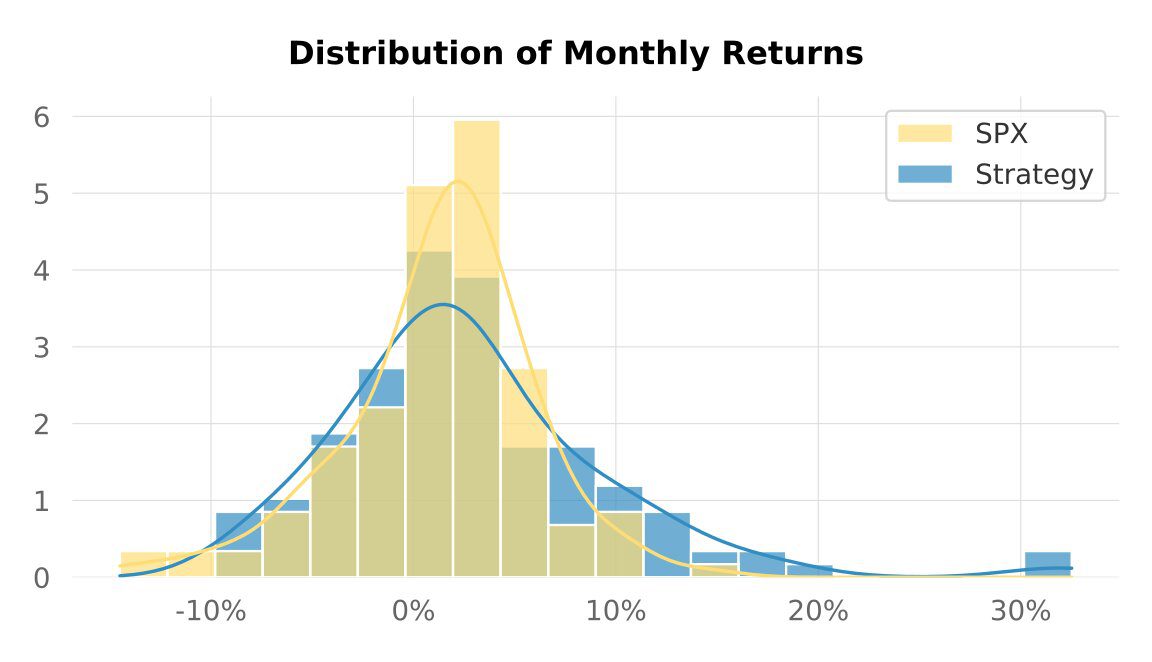
Return distribution
One result worth flagging: the combined book is left-skewed (−2.49) and fat-tailed (kurtosis 52.4) – the opposite tail shape from the standalone US-equity sleeve (317), which was right-skewed (+3.33). Pooling the two books on one cash account introduced a sharp left tail driven by the November 2020 session. Read the monthly heatmap and the distribution charts with that in mind: the average month looks good, but the worst day is far out in the left tail.
Caveats & reading guide
- Backtest, not a live track record. Costs and slippage are modelled at bar level only. Real fills across a ~5,000-name universe – including illiquid small-caps and non-US listings – would degrade these returns.
- Combining did not reduce drawdown. Two long-only equity-beta books on a shared cash pool raised gross exposure (~77%) and drew down together in November 2020. Calmar (1.28) is below both standalone sleeves (1.72 and 2.28). The blend buys a higher Sharpe at the cost of a deeper tail.
- Sharp left tail. Skew −2.49, kurtosis 52.4, worst day −26.42%. The −27.13% max drawdown is essentially one session. Distribution-sensitive risk measures matter more here than the smooth-looking CAGR.
- Recent-heavy curve. The equity curve is near-vertical in 2025-2026 (2025 +72%, 2026-to-date +65%). A large share of the cumulative outperformance is concentrated in the last ~18 months; treat the headline CAGR as regime-dependent, not a steady-state expectation.
- RF mismatch across reports. This combined report uses RF = 0%; the two parent reports used RF ≈ 13.6-13.9%. Only compare Sharpe/Sortino/Calmar on the RF-flat basis (combined 1.48 vs parents’ RF-flat ≈ 0.81 and 0.96).
- Window clipping. The QuantStats matched-window CAGR (34.84%) differs slightly from the engine’s raw portfolio CAGR (~36%) because of warm-up clipping. Figures here use the QuantStats matched window throughout.
- Universe frictions. Possible residual survivorship bias in both universes; KOSPI 50 and other non-US names add FX and venue frictions not fully modelled.
- Regime mix is not universe-specific. The ≈78% trend / 8% range / 15% bear split is benchmark/VIX-percentile driven and is identical across all our reports on this window.
- Parameters were tuned on an early window. For each sleeve, 2020 onward is the more honest out-of-sample view. Hard cutoff: the strategy’s rules and parameters were frozen on 3 July 2025, so all performance after that date is genuine out-of-sample / forward-tracked data – unseen at selection time, with no hindsight possible.
Discuss this backtest
We publish backtest research and strategy commentary, and the discussion happens in our free community channels – Telegram, Discord and X/Twitter. If you want to dig into how two systematic books behave when they share a cash pool, or push back on the drawdown reading above, that is the place to do it. See the community page for the channels and the full disclaimer.
Reminder: everything above is a historical simulation shared for informational and educational purposes only. It is not financial advice, not a recommendation, and not a solicitation to invest. Past simulated performance does not guarantee future results, and the gap between a backtest and live trading is exactly the kind of thing this site exists to keep honest.

0 Comments