Voici une stratégie basée sur une liste de 77 ETFs parmi ceux disponibles pour ceux qui ont une assurance vie Linxea Spirit2.
Ceci est un backtest historique, publié à des fins d’information et d’éducation uniquement , il ne s’agit pas d’un conseil en investissement, ni d’une recommandation, ni d’un signal de trading. Les performances passées ne préjugent pas des résultats futurs.
Input Parameters
| Parameter | Value |
|---|---|
| strategy_buy | ichimoku4a |
| strategy_sell | ichimoku6a |
| leverage | 1.0 |
| interest_rate_annual_pct | 7.0 |
| date_start_simulation | 2018-01-02 00:00:00+00:00 |
| date_start | 2016-12-20 00:00:00+00:00 |
| date_end | 2026-02-28 00:00:00+00:00 |
| base_currency | EUR |
| initial_cash | 100000.0 |
| position_target_w | 0.2 |
| position_target_hard_limit | 10000000.0 |
| bar_size | 1 day |
| nbar_back_for_stop | 0 |
| trailing_stop | 0.0 |
| stop_limit | False |
| nbar_freeze | 15 |
| enable_freeze_global | False |
| position_max_w | 0.30000000000000004 |
| max_entry_per_bar | 10 |
| min_value_traded | 0.0 |
| skip_zero_volume | False |
| min_price_threshold | 0.0 |
| exposure_penalty_trigger_pct | 5.0 |
| stability_penalty_trigger | 0.3 |
| no_sell_all | False |
| nb_symbol | 77 |
Results Summary
| Metric | Value |
|---|---|
| equity_final | 380955.8538 |
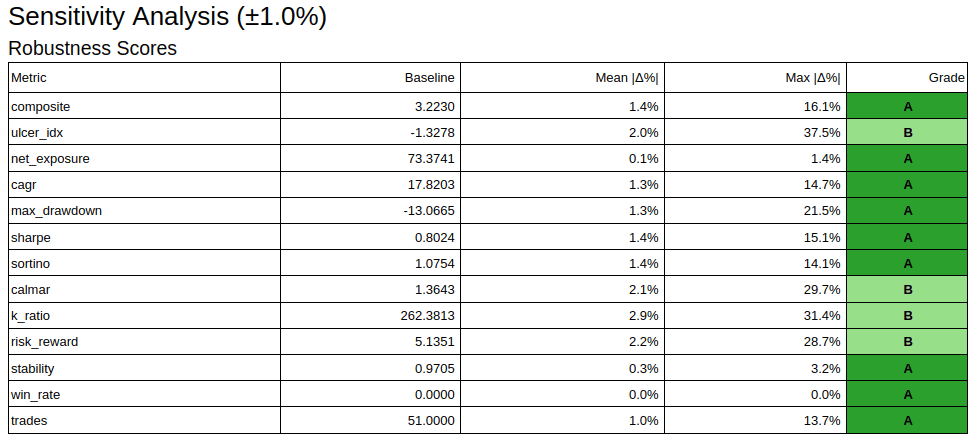
| cagr_pct | 17.8203 |
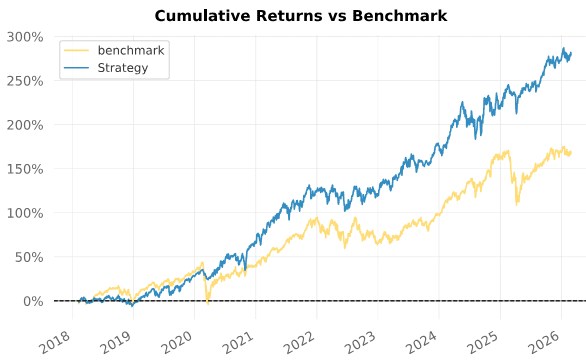
| return | 280.9559 |
| max_drawdown_pct | 13.0665 |
| ulcer_index_pct | 1.3278 |
| net_exposure_pct | 73.3741 |
| sharpe_ratio | 0.8024 |
| sortino_ratio | 1.0754 |
| calmar_ratio | 1.3643 |
| benchmark_cagr | 5.0000 |
| trades | 51 |
| win_rate | 0.7255 |
| risk_reward_ratio | 5.1351 |
| kelly_pct | 67.2033 |
| return_mean | 19.1644 |
| return_min | -14.8713 |
| return_q0.01 | -13.7139 |
| return_q0.05 | -11.1497 |
| return_q0.2 | -0.9044 |
| return_q0.5 | 6.6978 |
| return_q0.8 | 38.7230 |
| return_q0.95 | 73.1495 |
| return_q0.99 | 139.1080 |
| return_max | 179.0130 |
Key Performance Metrics
| Metric | SPX | Strategy |
|---|---|---|
| Risk-Free Rate | 5.0% | 5.0% |
| Time in Market | 98.0% | 100.0% |
| Cumulative Return | 167.44% | 278.93% |
| CAGR﹪ | 12.74% | 17.63% |
| Sharpe | 0.46 | 0.79 |
| Prob. Sharpe Ratio | 40.84% | 80.58% |
| Smart Sharpe | 0.44 | 0.76 |
| Sortino | 0.64 | 1.11 |
| Smart Sortino | 0.61 | 1.07 |
| Sortino/√2 | 0.45 | 0.79 |
| Smart Sortino/√2 | 0.43 | 0.75 |
| Omega | 1.09 | 1.15 |
| Max Drawdown | -33.43% | -13.07% |
| Max DD Date | 2020-03-23 | 2024-08-05 |
| Max DD Period Start | 2020-02-20 | 2024-05-21 |
| Max DD Period End | 2021-01-12 | 2024-09-25 |
| Longest DD Days | 475 | 422 |
| Volatility (ann.) | 19.54% | 15.93% |
| R^2 | 0.15 | 0.15 |
| Information Ratio | 0.01 | 0.01 |
| Calmar | 0.38 | 1.35 |
| Skew | -0.41 | -0.38 |
| Kurtosis | 16.0 | 2.13 |
| Ulcer Performance Index | 22.61 | 71.77 |
| Risk-Adjusted Return | 13.0% | 17.63% |
| Risk-Return Ratio | 0.04 | 0.07 |
| Avg. Return | 0.06% | 0.07% |
| Avg. Win | 0.84% | 0.83% |
| Avg. Loss | -1.0% | -0.86% |
| Win/Loss Ratio | 0.84 | 0.96 |
| Profit Ratio | 0.67 | 0.77 |
| Expected Daily | 0.05% | 0.06% |
| Expected Monthly | 1.02% | 1.38% |
| Expected Yearly | 11.55% | 15.95% |
| Kelly Criterion | 2.29% | 9.21% |
| Risk of Ruin | 0.0% | 0.0% |
| Daily Value-at-Risk | -1.97% | -1.58% |
| Expected Shortfall (cVaR) | -3.18% | -2.33% |
| Max Consecutive Wins | 10 | 12 |
| Max Consecutive Losses | 7 | 7 |
| Gain/Pain Ratio | 0.15 | 0.21 |
| Gain/Pain (1M) | 1.0 | 1.9 |
| Payoff Ratio | 0.84 | 0.96 |
| Profit Factor | 1.15 | 1.21 |
| Common Sense Ratio | 1.05 | 1.08 |
| CPC Index | 0.53 | 0.65 |
| Tail Ratio | 0.91 | 0.9 |
| Outlier Win Ratio | 3.47 | 3.48 |
| Outlier Loss Ratio | 4.02 | 3.72 |
| MTD | -0.53% | 0.39% |
| 3M | -0.88% | 2.13% |
| 6M | 4.86% | 8.57% |
| YTD | -0.11% | 1.34% |
| 1Y | 2.49% | 11.67% |
| 3Y (ann.) | 16.6% | 18.41% |
| 5Y (ann.) | 11.52% | 15.24% |
| 10Y (ann.) | 12.74% | 17.63% |
| All-time (ann.) | 12.74% | 17.63% |
| Best Day | 10.02% | 5.31% |
| Worst Day | -12.56% | -5.0% |
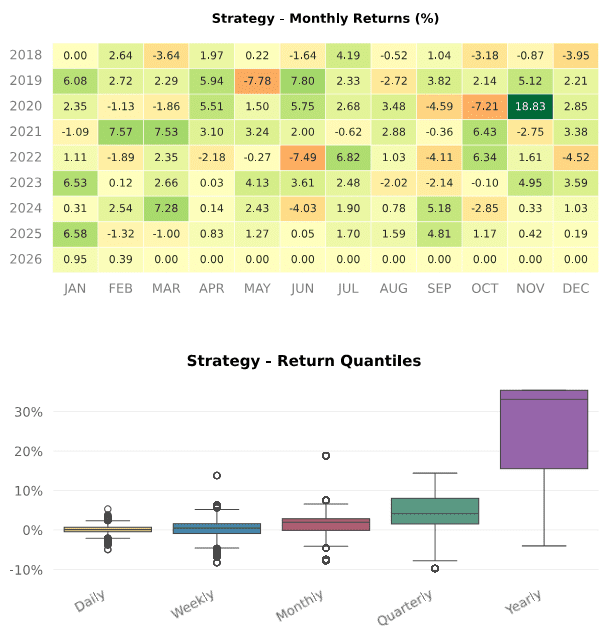
| Best Month | 13.53% | 18.83% |
| Worst Month | -12.6% | -7.78% |
| Best Year | 36.18% | 35.42% |
| Worst Year | -14.32% | -4.03% |
| Avg. Drawdown | -2.44% | -2.24% |
| Avg. Drawdown Days | 24 | 18 |
| Recovery Factor | 3.41 | 11.0 |
| Ulcer Index | 0.07 | 0.04 |
| Serenity Index | 1.07 | 4.14 |
| Avg. Up Month | 3.81% | 3.69% |
| Avg. Down Month | -4.57% | -2.93% |
| Win Days | 55.4% | 55.43% |
| Win Month | 64.95% | 70.1% |
| Win Quarter | 72.73% | 78.79% |
| Win Year | 77.78% | 77.78% |
| Beta | – | 0.32 |
| Alpha | – | 0.13 |
| Correlation | – | 39.05% |
| Treynor Ratio | – | 860.25% |
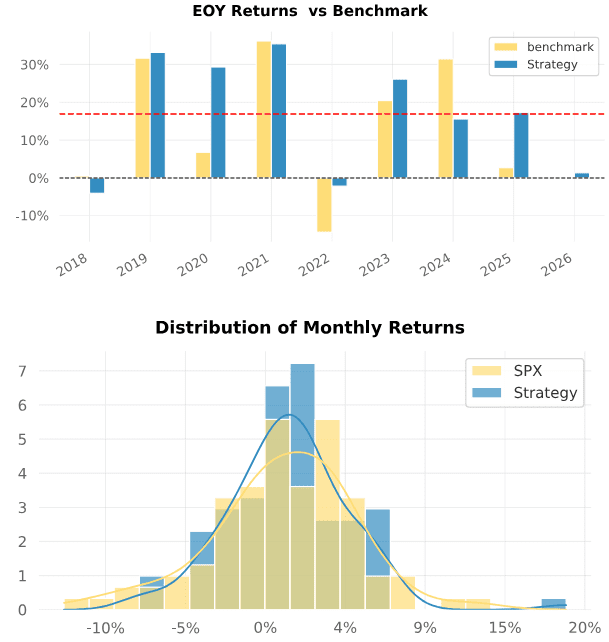
EOY Returns vs Benchmark
| Year | SPX | Strategy | Multiplier | Won |
|---|---|---|---|---|
| 2018 | 0.49 | -4.03 | -8.28 | – |
| 2019 | 31.62 | 33.14 | 1.05 | + |
| 2020 | 6.76 | 29.30 | 4.34 | + |
| 2021 | 36.18 | 35.42 | 0.98 | – |
| 2022 | -14.32 | -2.16 | 0.15 | + |
| 2023 | 20.42 | 26.10 | 1.28 | + |
| 2024 | 31.43 | 15.55 | 0.49 | – |
| 2025 | 2.68 | 17.24 | 6.43 | + |
| 2026 | -0.11 | 1.34 | -11.72 | + |
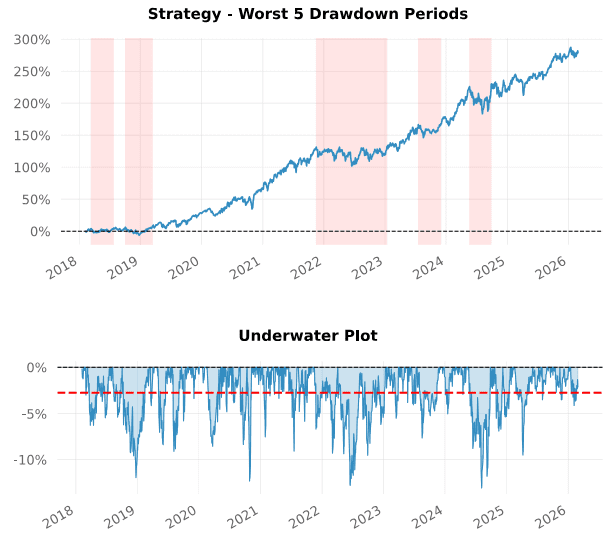
Worst 10 Drawdowns
| Started | Recovered | Drawdown | Days |
|---|---|---|---|
| 2024-05-21 | 2024-09-25 | -13.07 | 128 |
| 2021-11-17 | 2023-01-12 | -12.80 | 422 |
| 2020-10-14 | 2020-11-06 | -12.32 | 24 |
| 2018-10-04 | 2019-03-12 | -11.95 | 160 |
| 2025-02-19 | 2025-06-03 | -9.50 | 105 |
| 2019-07-29 | 2019-09-19 | -9.09 | 53 |
| 2021-06-18 | 2021-08-05 | -9.08 | 49 |
| 2020-02-20 | 2020-05-08 | -8.55 | 79 |
| 2019-04-30 | 2019-06-28 | -8.38 | 60 |
| 2020-09-03 | 2020-10-12 | -8.36 | 40 |
Données hors échantillon. Les règles et paramètres de cette stratégie ont été figés le 3 juillet 2025. Toute performance postérieure à cette date est strictement hors échantillon (suivie en conditions réelles) : étant postérieure au gel des paramètres, elle n’a pu être influencée par aucun biais de sélection a posteriori.
Questions frequentes (FAQ)
Sur quel univers porte ce backtest ?
Sur une liste de 77 ETF disponibles dans le contrat d’assurance vie Linxea Spirit2, en bougies journalieres, en euros, du 2 janvier 2018 au 28 fevrier 2026, avec un capital initial de 100 000 euros.
Quels sont les resultats principaux ?
Un CAGR de 17,8% pour un drawdown maximal de 13,1%, un ratio de Sharpe de 0,80, un Sortino de 1,08 et un Calmar de 1,36, sur 51 transactions avec un taux de reussite de 72,6%. La performance et le drawdown se lisent ensemble, jamais separement.
La strategie reste-t-elle investie en permanence ?
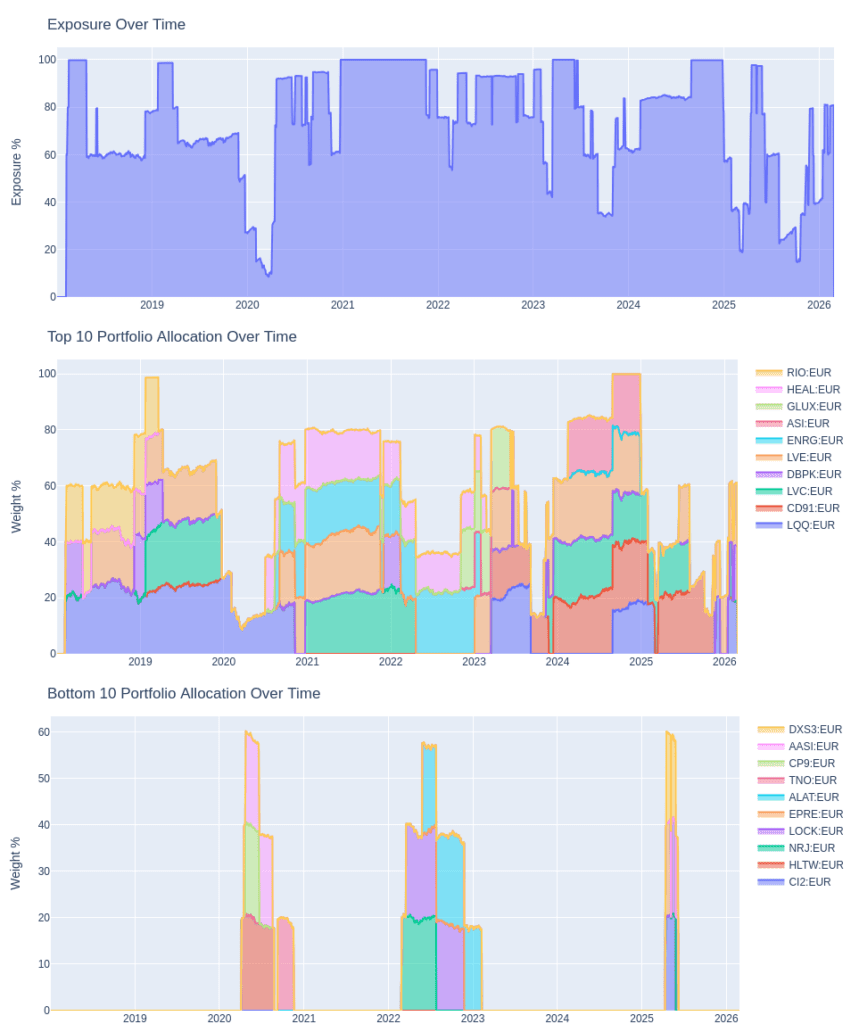
Non. L’exposition nette moyenne est de 73,4%, donc une partie du capital reste en liquidites sur une part significative de la periode.
Y a-t-il un stop suiveur sur ce backtest ?
Non. Le parametre trailing_stop vaut 0 sur ce run. Les sorties sont pilotees uniquement par la regle de vente, un signal de la famille Ichimoku, avec un gel de 15 barres apres chaque sortie pour eviter les reentrees immediates.
Ce backtest constitue-t-il un conseil en investissement ?
Non. Il s’agit d’un backtest historique publie a des fins d’information et d’education. Ce n’est ni un conseil en investissement, ni une recommandation, ni un signal de trading. Les performances passees ne prejugent pas des resultats futurs.

0 Comments