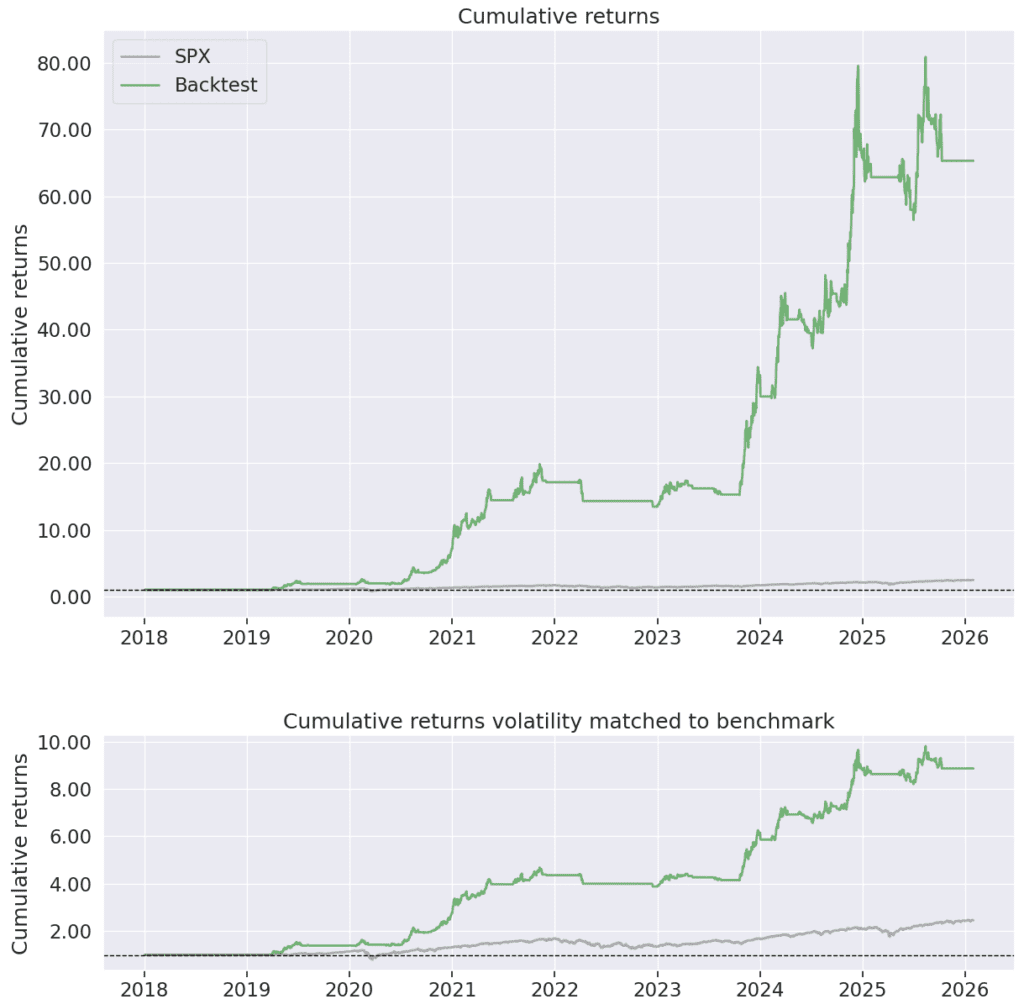
29% Exposure – 1.66 Sharpe – 32% Max Drawdown (2018-2026)
Most crypto backtests lead with absurd equity curves.
This one doesn’t.
Let’s start with what actually matters:
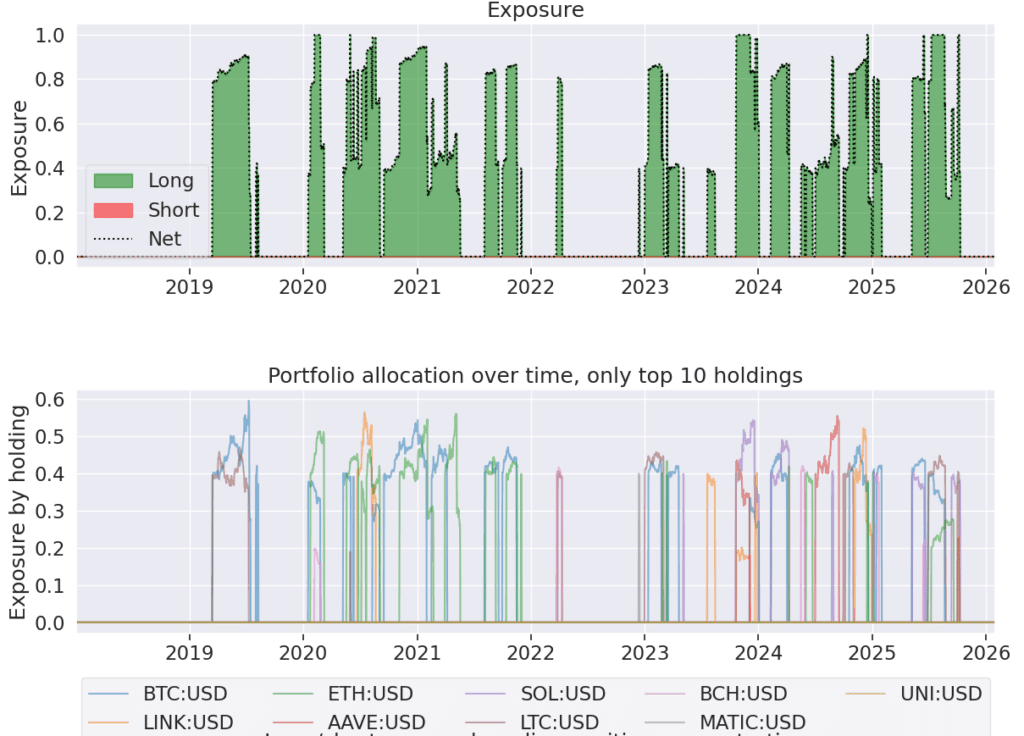
- Net exposure: 29.4%
- Max drawdown: −32.3%
- Sharpe ratio: 1.66
- Calmar ratio: 2.10
- Ulcer index: 5.56%
- Trades: 71 over 8 years
CAGR is 67.7%, but that’s not the point.
The point is return per unit of exposure and drawdown control.
1. Strategy Design Philosophy
This is not a prediction model.
It is a regime participation system designed to:
- Enter volatility expansion phases
- Confirm structural trend alignment
- Exit aggressively when regime deteriorates
- Stay in cash most of the time
Average exposure over 8 years: 29%
It avoids the structural crypto bear phases instead of trying to survive them.
2. Architecture
Entry Layer
- Bollinger-based regime trigger (
bband2a) - Detects volatility compression → expansion
Exit Layer
Ensemble of:
ichimoku6aichimoku5aichimoku4a
Exit logic is deliberately redundant.
Risk Layer
- 32% trailing stop
- No leverage
- Position target: 40%
- Max position cap: 60%
- 7% annual interest on idle cash
Universe:
- 9 liquid USD crypto pairs
- Daily bars
- Long-only
3. Configuration
Strategy Configuration
| Category | Parameter | Value |
|---|---|---|
| Core Setup | Bar Size | 1 Day |
| Universe Size | 9 Crypto Pairs (USD) | |
| Leverage | 1.0 (No leverage) | |
| Initial Capital | $100,000 | |
| Interest on Cash | 7% Annual | |
| Signal Engine | Entry Logic | Bollinger Regime (bband2a) |
| Exit Logic | Ichimoku Ensemble (6a + 5a + 4a) | |
| Scoring Model | Weighted Composite (16 factors) | |
| Freeze Bars | 2 Bars | |
| Risk Management | Trailing Stop | 32% |
| Position Target Weight | 40% | |
| Max Position Weight | 60% | |
| Max Entries per Bar | 10 | |
| Exposure Controls | Exposure Penalty Trigger | 5% |
| Stability Penalty Trigger | 0.30 | |
| Backtest Period | Data Start | 20 Dec 2016 |
| Simulation Start | 02 Jan 2018 – 31 Jan 2026 |
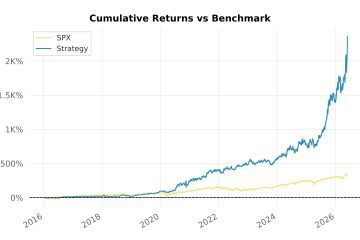
4. Performance Summary (2018-2026)
Initial capital: $100,000
Final equity: $6,531,155
But again, focus on structure:
Performance Summary (2018-2026)
| Metric | Value |
|---|---|
| Final Equity | $6,531,156 |
| Total Return | +6,431% |
| CAGR | 67.74% |
| Max Drawdown | −32.26% |
| Ulcer Index | 5.56% |
| Sharpe Ratio | 1.66 |
| Sortino Ratio | 2.53 |
| Calmar Ratio | 2.10 |
| Stability | 0.935 |
| K-Ratio | 203.41 |
| Net Exposure | 29.40% |
| Trades | 71 |
| Win Rate | 60.56% |
| Risk / Reward | 7.76 |
| Kelly Fraction | 55.48% |
71 trades in 8 years.
This is a slow, selective trend system, not hyperactive trading.
5. Distribution Profile
Trade return distribution:
- Median: +3.0%
- 80th percentile: +54%
- 95th percentile: +192%
- Worst trade: −25.9%
This is clearly positively skewed.
Performance is driven by:
- Few large structural trend captures
- Limited downside per trade
- Strict exit discipline
It does not rely on high win rate.
It relies on asymmetric payoff.
6. Risk Characteristics
Drawdown Profile
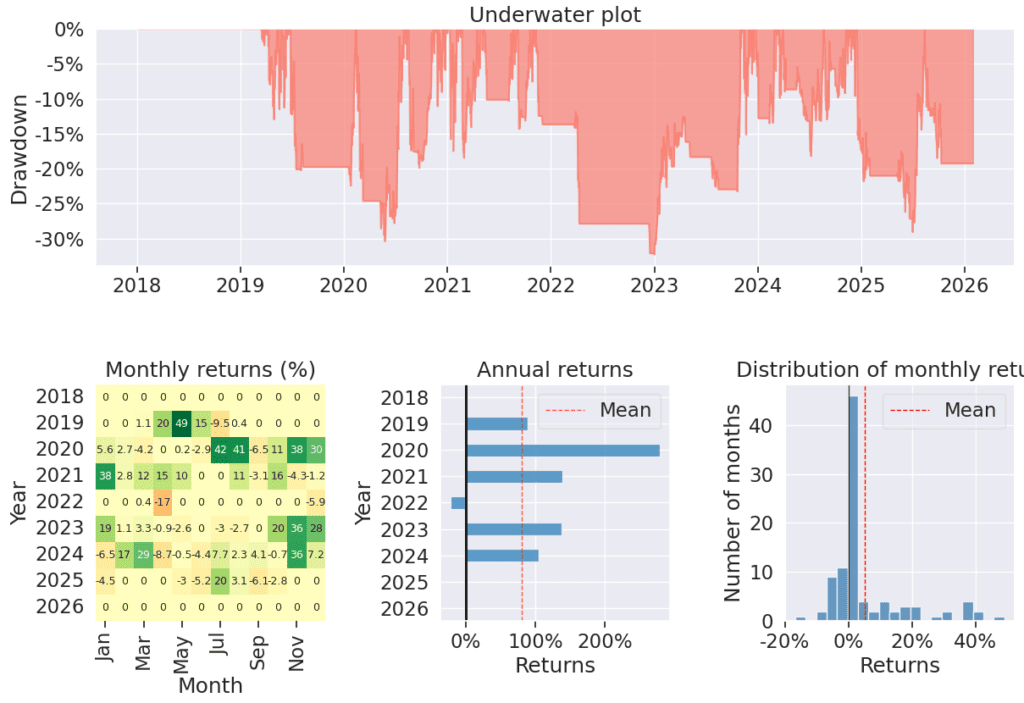
Max DD: −32%
In crypto terms, that is materially lower than passive exposure.
More important:
Ulcer index = 5.56%
Meaning drawdowns are not only shallow, but relatively short-lived.
Stability
Stability score: 0.935
K-ratio: 203
The equity curve is statistically smooth relative to asset volatility.
That suggests:
- Regime filtering is doing real work
- Not pure beta harvesting
6. What This Is NOT
Let’s be explicit:
- Not slippage-stress-tested yet
- No liquidity impact modeling
- Universe limited to 9 assets
- Crypto structural bull market tailwind (2020-2021)
- Trailing stop execution on daily bars may overestimate fills
This is research-grade, not audited live performance.
7. Why This Is Interesting
The key metric here is:
67% CAGR at 29% exposure
If exposure were 100%, risk profile would be completely different.
This suggests the system is:
- Efficient at timing participation
- Avoiding large bear regimes
- Capturing convexity phases
That is structurally different from buy-and-hold.
8. What Needs to Be Proven Next
Before considering capital deployment:
- Walk-forward optimization
- Parameter perturbation test (±20% sensitivity)
- Slippage stress test (0.1-0.5%)
- Sub-universe validation
- Post-2024 strict out-of-sample monitoring
- Exposure cap reduction to 20% to test robustness
If performance collapses under minor perturbations, edge is fragile.
If not, we may have something durable.
9. Bottom Line
This is not about turning $100k into $6M.
It’s about:
- Controlled participation
- Positive skew
- Low exposure efficiency
- Stable equity compounding
The next step is robustness validation – not marketing.
Out-of-sample cutoff. This strategy’s rules and parameters were frozen on 3 July 2025. All performance shown after that date is genuine out-of-sample / forward-tracked data – it post-dates the freeze, so no hindsight or selection could have shaped the rules.
This is a historical backtest, published for informational and educational purposes only – not financial advice, not a recommendation, and not a trading signal. Past performance is not indicative of future results.
Backtest output and ongoing research:
→ Community channels
→ https://x.com/kreamedge
See the discussion on X/Twitter.

0 Comments