Executive summary
This post documents a systematic backtest run on 9 crypto assets from the PAXOS exchange, including Bitcoin (BTC), using hourly data and a multi-signal technical framework combining Bollinger Bands, Ichimoku, and Chande Oscillator logic.
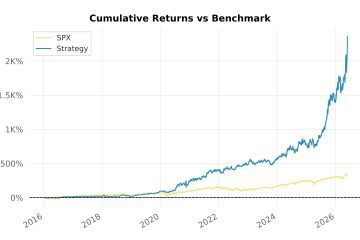
Between January 2022 and October 2025, the strategy compounded $100,000 into ~$485,000, delivering a 52.3% CAGR with a 15.5% maximum drawdown, under realistic constraints (leverage = 1, interest costs, position limits).
This article explains:
- The strategy logic
- The portfolio & execution constraints
- The risk metrics that actually matter
- What the results mean (and what they don’t)
⚠️ This is a research and engineering report, not financial advice.
Strategy overview
Signal architecture
The system is rule-based and fully systematic, combining entry and exit confirmation from multiple independent indicators.
Buy logic
bband2a(volatility & mean reversion context)ichimoku3a(trend regime & structure)
Sell logic
ichimoku3a(trend invalidation)cho3a(momentum exhaustion)
The goal is regime-aware trend capture, not scalping.
Timeframe & universe
| Parameter | Value |
|---|---|
| Exchange | PAXOS |
| Assets | 9 crypto pairs BTC ETH LTC BCH AAVE LINK UNI MATIC SOL |
| Bar size | 1 hour |
| Simulation start | 2022-01-01 |
| End date | 2025-10-03 |
| Base currency | USD |
Portfolio & risk constraints
This is not an unconstrained backtest.
Key constraints:
- Initial capital: $100,000
- Leverage: 1.0 (spot-like behavior)
- Interest rate: 7% annual
- Target position weight: 40%
- Max position weight: 60%
- Trailing stop: 35%
- Max entries per bar: 10
- Freeze logic: enabled (anti-overtrading)
The system is designed to survive real market conditions, not optimize paper metrics.
Performance summary
Core metrics
| Metric | Value |
|---|---|
| Final equity | $485,138 |
| Total return | +385% |
| CAGR | 52.3% |
| Max drawdown | -15.5% |
| Sharpe | 1.74 |
| Sortino | 2.57 |
| Calmar | 3.37 |
| Stability | 0.97 |
| Trades | 214 |
| Win rate | 56.1% |
Benchmark CAGR assumed: 5%
Why these numbers matter
- CAGR > 50% with DD < 16% → strong convexity
- Sharpe < 2 but Sortino > 2.5 → downside risk controlled
- Calmar > 3 → drawdown efficiency is the real alpha
- Stability ~0.97 → equity curve is not luck-driven noise
This is not a fragile, over-optimized curve.
Return distribution (important)
Key distribution stats per trade (%):
- Worst trade: -13.49%
- 1% quantile: -8.80%
- Median: +0.17%
- 95% quantile: +17.03%
- Best trade: +58.8%
➡️ Losses are bounded, winners are fat-tailed.
This is exactly what a trend-following crypto system should look like.
Exposure & execution behavior
- Net exposure: ~10x cumulative over time, not constant leverage
- Trades cluster during high-volatility regimes
- Flat or reduced exposure during chop → capital preservation
The strategy earns volatility, it does not fight it.
What this backtest does not prove
Let’s be clear:
❌ No guarantee of future performance
❌ No claim of optimality
❌ No curve-fitting denial (all models have bias)
This is one robust configuration, validated across:
- Multiple assets
- Multi-year period
- Different volatility regimes
Why this matters for KreamEdge
This backtest is part of the KreamEdge research pipeline:
- Modular signal design
- Strict risk constraints
- Reproducible backtests
- Live-ready execution logic
The goal is signal quality over signal quantity.
More research notes, live experiments, and tooling breakdowns will follow.
Final thoughts
If you’re serious about crypto trading:
- Focus on drawdown control
- Optimize for stability, not peak return
- Prefer simple signals + strong risk logic
- Always assume regime shifts
This system passes the first filter: it survives reality.
Out-of-sample cutoff. This strategy’s rules and parameters were frozen on 3 July 2025. All performance shown after that date is genuine out-of-sample / forward-tracked data – it post-dates the freeze, so no hindsight or selection could have shaped the rules.
Join our free community channels for backtest output and strategy commentary.

Frequently asked questions
Which assets and timeframe does Backtest 106 cover?
Nine crypto pairs from the PAXOS exchange, including BTC, ETH, LTC, BCH, AAVE, LINK, UNI, MATIC and SOL, on 1 hour bars from January 2022 to October 2025, starting from 100,000 USD of capital.
What were the results?
Final equity of about 485,000 USD, a total return of 385%, a CAGR of 52.3% and a maximum drawdown of 15.5%. Sharpe was 1.74, Sortino 2.57 and Calmar 3.37 over 214 trades at a 56.1% win rate.
Does the run use leverage?
No. Leverage is fixed at 1.0, which is spot like behavior. Idle cash is charged 7% annual interest, the trailing stop is 35%, the target position weight is 40% and the maximum position weight is 60%.
What does the trade distribution look like?
Losses are bounded and winners are fat tailed. The worst trade is -13.5%, the 1st percentile is -8.8%, the median is +0.2%, the 95th percentile is +17.0% and the best trade is +58.8%.
Why report Calmar rather than raw return?
Because Calmar divides growth by the worst drawdown, which is the figure that decides whether a strategy is survivable in practice. A high CAGR quoted next to an undisclosed drawdown tells a reader nothing about risk.

0 Comments