This post documents a systematic backtest of a crypto strategy on Bitcoin. Over the backtest window, the strategy produced a 55% return alongside a 30% maximum drawdown , figures must be read together with risk and drawdown. The strategy parameter set and full backtest output are published to our free community channels. For informational and educational purposes only , not financial advice.
Input Parameters
| Parameter | Value |
|---|---|
| strategy_buy | ma0c&psar0a |
| strategy_sell | ichimoku6c |
| leverage | 1.0 |
| interest_rate_annual_pct | 7.0 |
| date_start_simulation | 2018-01-02 00:00:00+00:00 |
| date_start | 2016-12-20 00:00:00+00:00 |
| date_end | 2026-02-28 00:00:00+00:00 |
| base_currency | USD |
| initial_cash | 100000.0 |
| position_target_w | 0.4 |
| position_target_hard_limit | 10000000.0 |
| bar_size | 1 day |
| nbar_back_for_stop | 0 |
| trailing_stop | 28.0 |
| stop_limit | False |
| nbar_freeze | 2 |
| enable_freeze_global | False |
| position_max_w | 0.6000000000000001 |
| max_entry_per_bar | 10 |
| min_value_traded | 0.0 |
| skip_zero_volume | False |
| min_price_threshold | 0.0 |
| exposure_penalty_trigger_pct | 15.0 |
| stability_penalty_trigger | 0.5 |
| no_sell_all | False |
| target_price | None |
| target_duration | 65 |
| target_trend | -7.0 |
| nb_symbol | 9 |
Results Summary
| Metric | Value |
|---|---|
| equity_final | 3629429.7908 |
| cagr_pct | 55.3278 |
| return | 3529.4298 |
| max_drawdown_pct | 30.0875 |
| ulcer_index_pct | 4.3207 |
| net_exposure_pct | 19.0726 |
| sharpe_ratio | 1.5421 |
| sortino_ratio | 2.6342 |
| calmar_ratio | 1.8397 |
| benchmark_cagr | 5.0000 |
| trades | 35 |
| win_rate | 0.6571 |
| risk_reward_ratio | 8.0394 |
| kelly_pct | 61.4496 |
| return_mean | 57.4565 |
| return_min | -21.0663 |
| return_q0.01 | -20.9960 |
| return_q0.05 | -17.5624 |
| return_q0.2 | -9.1721 |
| return_q0.5 | 20.1785 |
| return_q0.8 | 101.7265 |
| return_q0.95 | 224.6643 |
| return_q0.99 | 319.5544 |
| return_max | 356.6240 |
| yearly_sortino | 2.6900 |
| yearly_downside_semidev | 0.4554 |
Frequently asked questions
What does Backtest 238 cover?
A long only, daily bar systematic strategy on nine crypto pairs quoted in USD, simulated from 2 January 2018 to 28 February 2026, starting from 100,000 USD with no leverage.
What were the headline results?
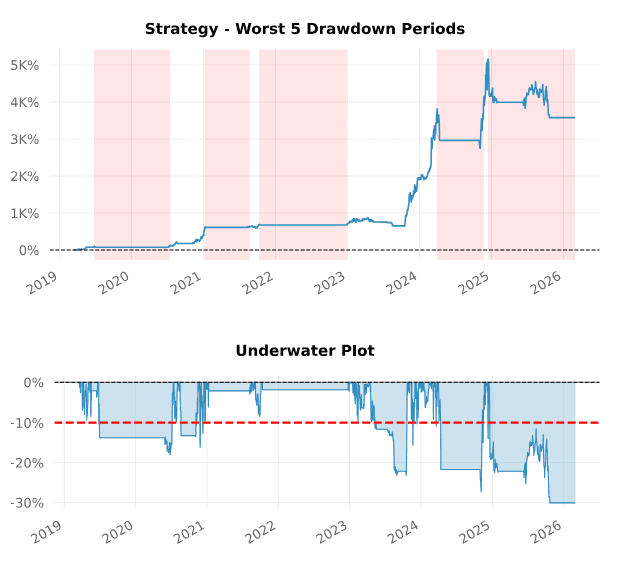
The engine summary reports a CAGR of 55.3% and a maximum drawdown of 30.1%, with Sharpe 1.54, Sortino 2.63 and Calmar 1.84 over 35 trades at a 65.7% win rate. The drawdown is the figure to read next to the CAGR.
Why does the tearsheet show a different CAGR from the results table?
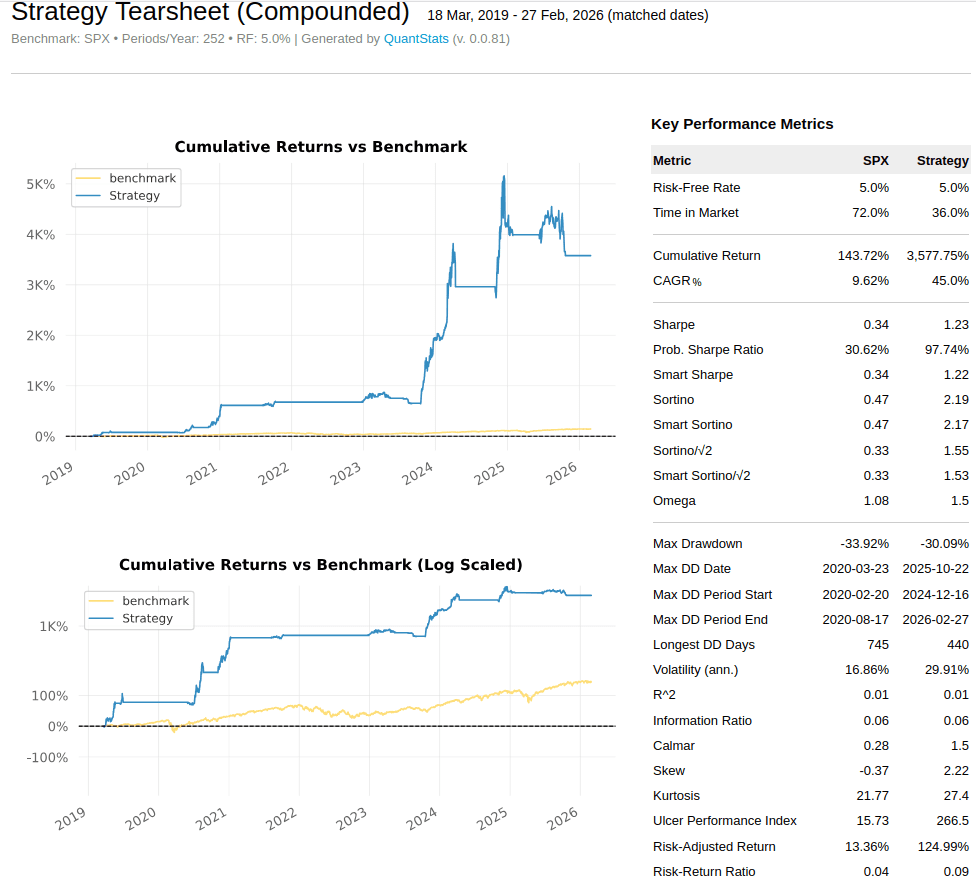
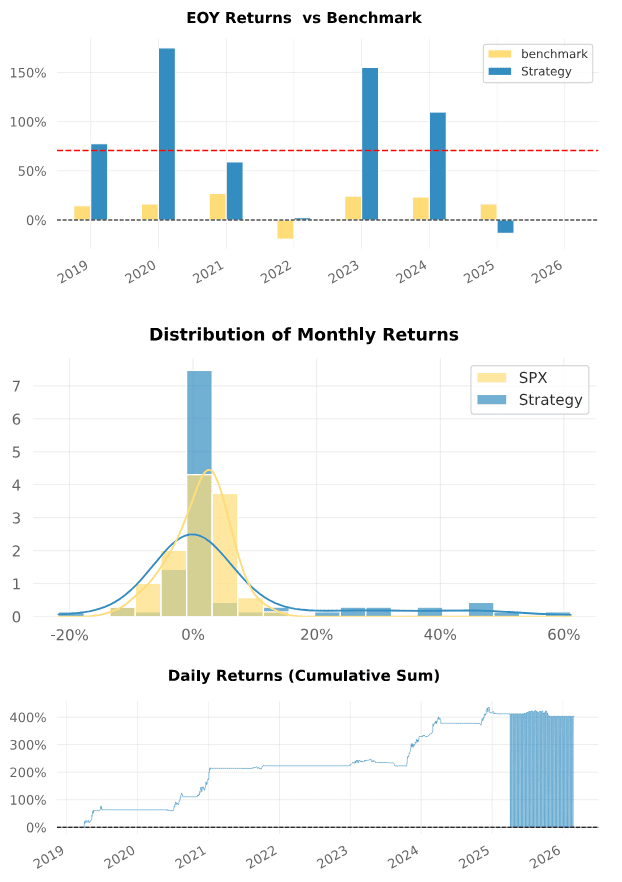
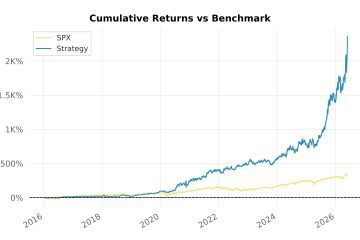
The two cover different windows. The engine summary runs from the simulation start, while the QuantStats tearsheet matches dates against the SPX benchmark and therefore starts on 18 March 2019, where it reports a CAGR of 45.0% against 9.62% for SPX. Neither figure is wrong; a like for like comparison against the benchmark should use the matched window.
How often is the strategy in the market?
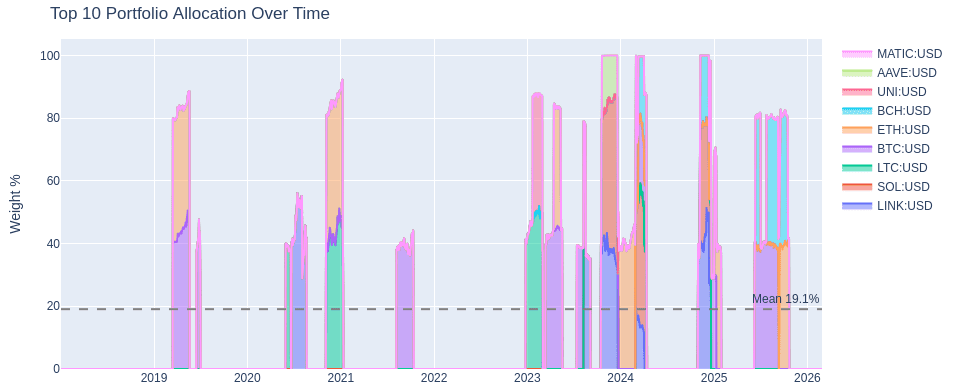
Net exposure averages 19.1%, so the book is in cash most of the time. The tearsheet reports time in market of 36% over the matched window.
Only 35 trades are reported. Is that enough?
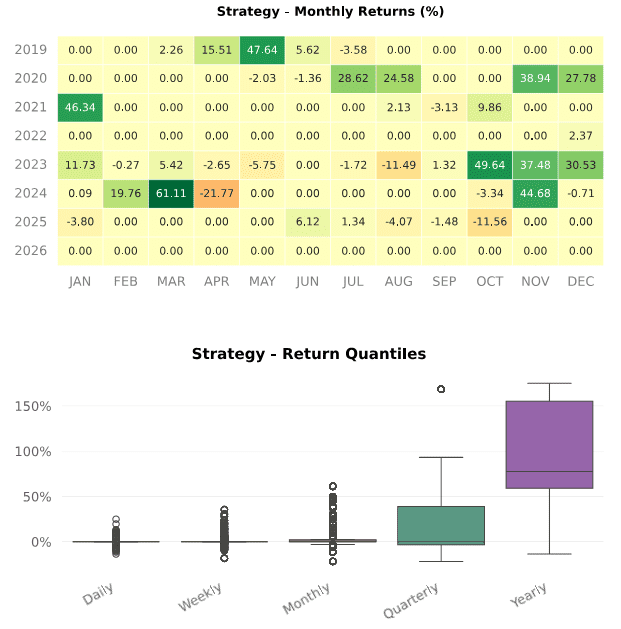
It is a small sample and should be treated as one. With 35 trades over eight years the result rests on a handful of positions, so the risk adjusted statistics carry wide uncertainty.
Is this a signal to trade?
No. This is a historical backtest published for informational and educational purposes only. It is not financial advice and not a recommendation. Past performance is not indicative of future results.

0 Comments