Backtest 333 evaluates a long-only, daily-bar systematic strategy on a universe of 942 world major-index constituents from 1 January 2016 to 31 August 2026 (≈ 10 years 8 months). Over that window the strategy compounds to a CAGR of 34.9% versus the S&P 500 total-return benchmark at 14.4%, with a max drawdown of -12.75% against the benchmark’s -33.92%.
This is a historical backtest, not a live track record and not a trading signal. We would not trade it as-is: it is research only. Past performance is not indicative of future results. Content is published for informational and educational purposes only – see the closing notes and our community page for the full disclaimer.
Headline numbers
| Metric | Strategy | Benchmark (SPX TR) |
|---|---|---|
| Period | 2016-01-01 → 2026-08-31 | |
| CAGR | 34.90% | 14.42% |
| Cumulative return | +2,335% | +315% |
| Max drawdown | -12.75% | -33.92% |
| Longest DD (days) | 213 | 745 |
| Volatility (annualized) | 18.91% | 17.79% |
| Sharpe | 0.99 | 0.10 |
| Sortino | 1.50 | 0.13 |
| Calmar | 2.78 | 0.42 |
| Time in market | 91% | 97% |
| Gross exposure (avg) | 47% | – |
| Beta to SPX | 0.22 | – |
| Trades | 764 | – |
| Win rate | 51.96% | – |
| Risk / reward | 2.03 | – |
| Skew | +0.07 | -0.38 |
| Kurtosis | 4.29 | 16.67 |
Relation to Backtest 308
Backtest 333 shares its rule family with Backtest 308: the same MACD-variant entry and Ichimoku + Parabolic-SAR exit logic, the same sizing and regime machinery. The two daily return series correlate at ρ = 0.89, so this is best read as a close sibling of 308, not as an independent confirmation of it.
What differs:
- Universe: 942 versus 1,006 names. 308 included KOSPI 50 Korean large caps; this run sits on the core world major-index constituent set alone.
- Window extended. 308 ended 30 April 2026; this run tracks through 31 August 2026, adding a full summer of out-of-sample data.
- Parameters re-tuned. The trailing stop tightens from 28% to 27%, and the internal scoring weights and parameter values behind the entry and exit codes were re-tuned independently of 308’s configuration.
Because ρ = 0.89 is high, the improvement in headline drawdown (-12.75% versus -14.36% on 308) should be attributed to the different parameterization and universe until a genuinely independent rule family shows the same profile.
Universe & period
The universe is the major-indices zone – 942 constituents of large world indices, daily bars, denominated in USD. The constituent list is the index composition as of 2026: the simulation carries those names back through the whole window and does not track which tickers entered or left the indices over time, which is a large survivorship bias on tickers (see the caveats). The simulation warms up indicators from 2014-12-19 and starts compounding from 2016-01-01 with $100,000 of initial capital, ending 2026-08-31.
Strategy in plain English
- Long-only, no shorts, no leverage.
- Entry: a MACD-variant trigger (internally
macdv1b). - Exit: a composite of Ichimoku and Parabolic-SAR rules (internally
ichimoku6a+psar0a), combined with a 27% trailing stop. - Sizing: volatility-targeted at the portfolio level, position cap 20%, sector cap 33%, max 10 new entries per bar.
- Cooldown: a freeze of 2 bars after each exit to avoid immediate re-entries.
- Regime awareness: a 252-bar percentile-based regime filter. Over the test window bars classify as ~78% trend, ~7% range, ~14% bear (see our follow-up null-result study on whether this filter actually improves backtest outcomes) – the strategy is permitted in all three but sizes down outside trend.
Equity curve
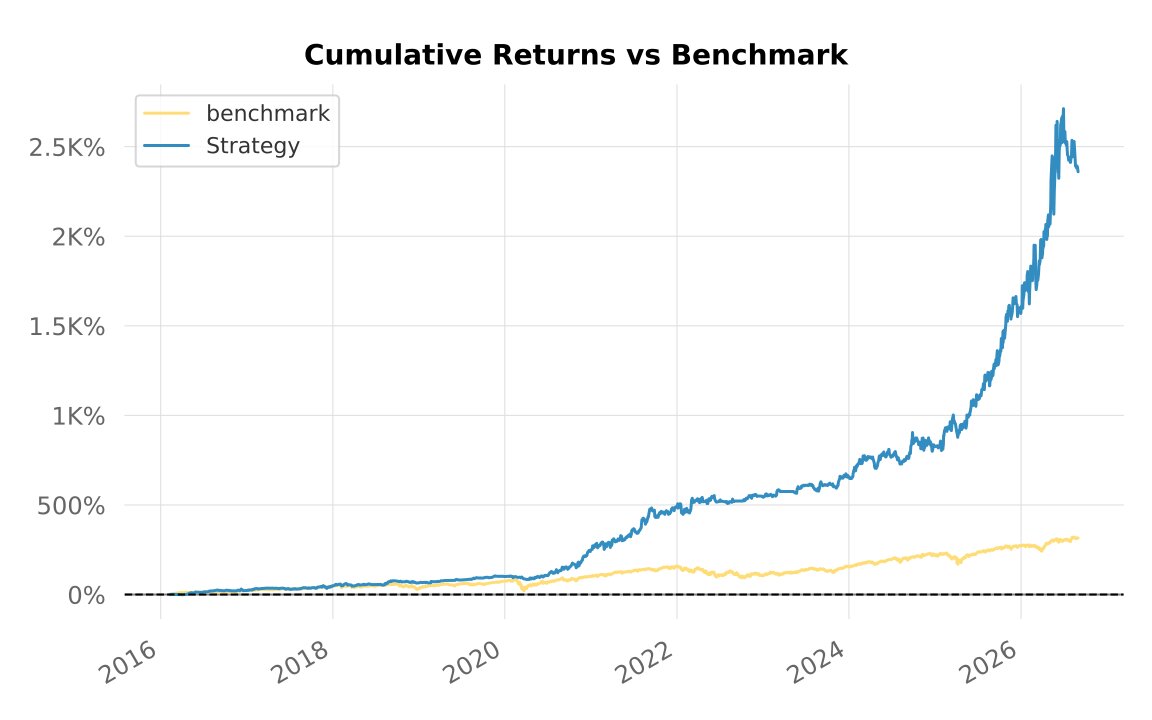
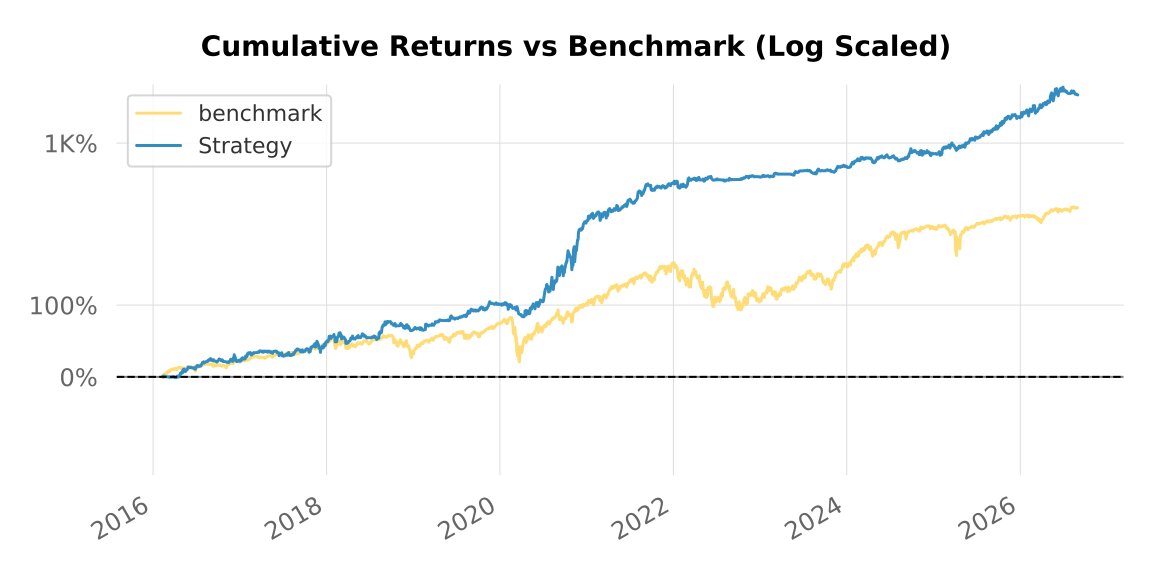
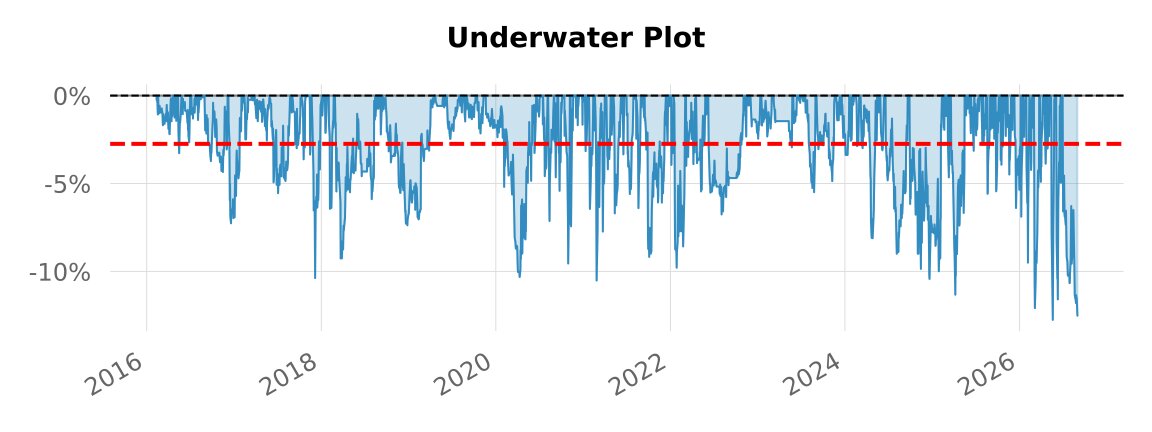
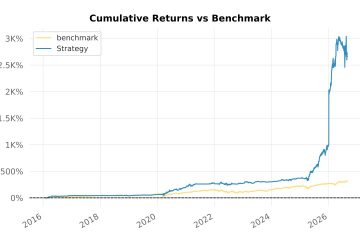
The out-of-sample degradation is visible on these curves. Watch the right edge: after the steep climb of the out-of-sample year, the since-inception annualized return rolls from about 37% in June 2026 to about 35% at the sample end, the curve sheds 12.51% from its early-July peak into the drawdown that is still open on 31 August, and June to August 2026 returns -9.5%. The drawdown analysis says the same from below: four of the ten deepest drawdowns of the whole record start in 2026, and the win rate drifts from 53.1% in-sample to 48.3% out-of-sample. Read the last segment of the curve as the forward record degrading in plain sight.
Annual returns
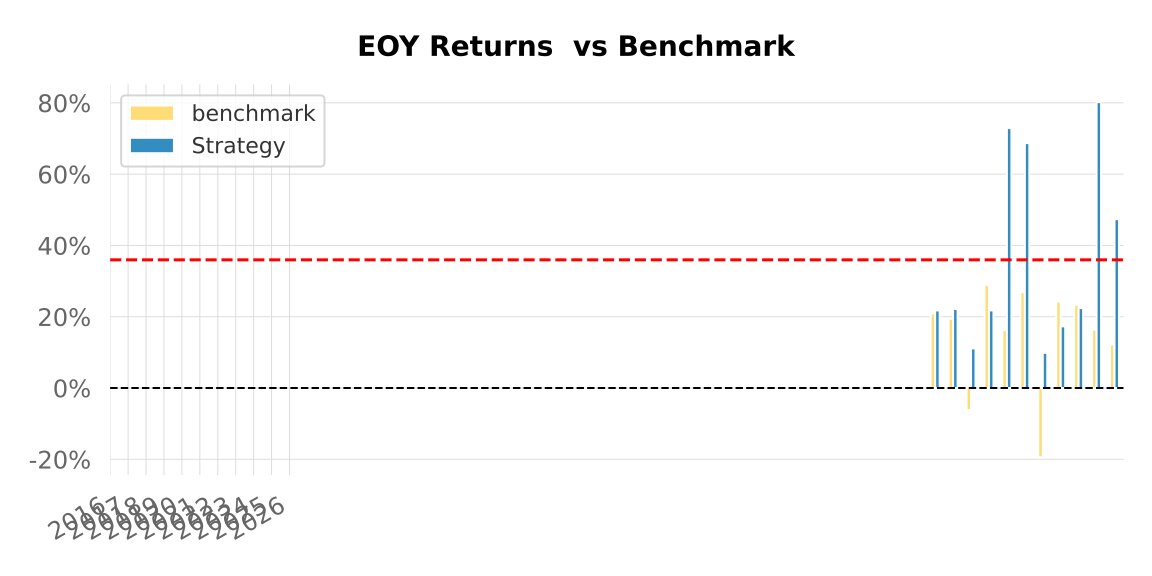
| Year | SPX | Strategy | Multiplier | Won |
|---|---|---|---|---|
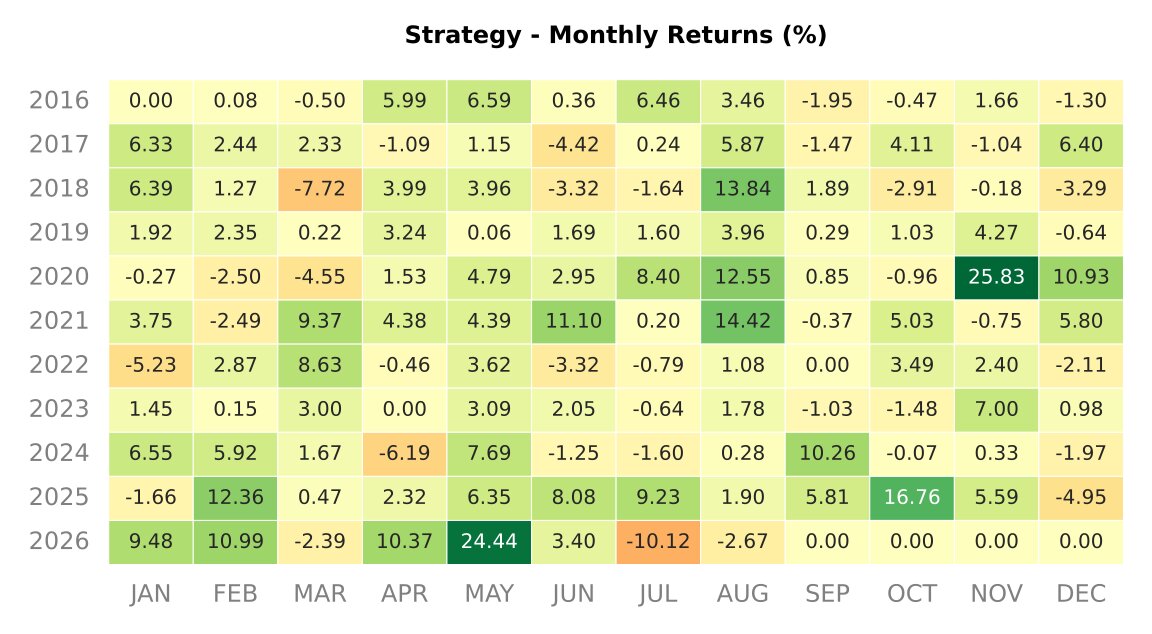
| 2016 | 20.87% | 21.76% | 1.04 | + |
| 2017 | 19.42% | 22.17% | 1.14 | + |
| 2018 | -6.24% | 11.11% | -1.78 | + |
| 2019 | 28.88% | 21.77% | 0.75 | – |
| 2020 | 16.26% | 72.91% | 4.48 | + |
| 2021 | 26.89% | 68.71% | 2.55 | + |
| 2022 | -19.44% | 9.87% | -0.51 | + |
| 2023 | 24.23% | 17.30% | 0.71 | – |
| 2024 | 23.31% | 22.41% | 0.96 | – |
| 2025 | 16.39% | 80.20% | 4.89 | + |
| 2026* | 12.25% | 47.37% | 3.87 | + |
Drawdown analysis
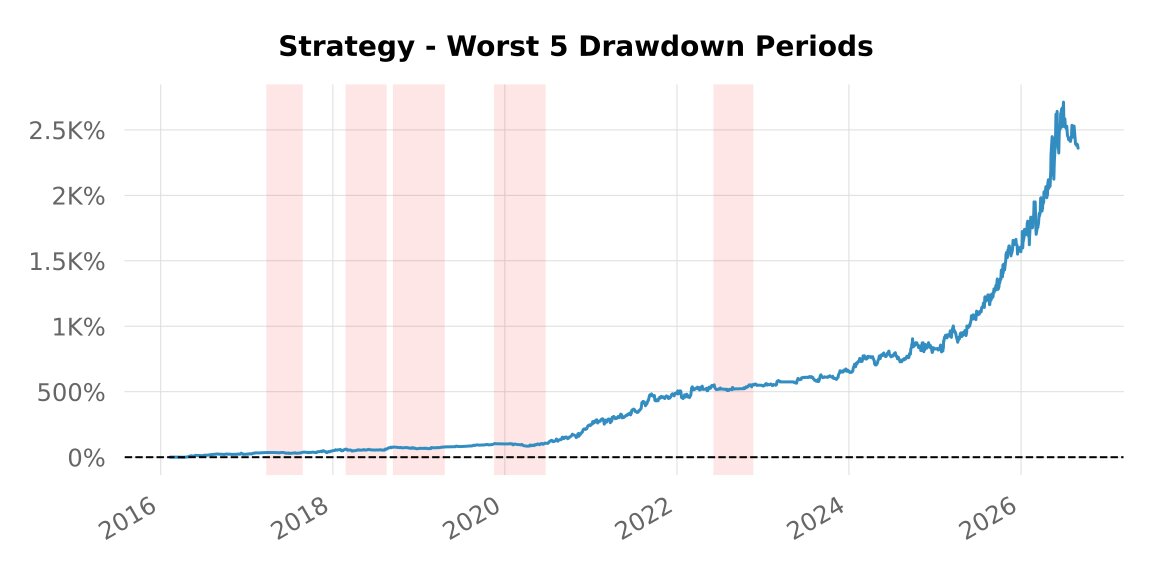
The deepest drawdown sits at -12.75% (14 to 27 May 2026), against the benchmark’s -33.92% peak-to-trough. The longest stretch under the previous peak ran 213 days, well inside the benchmark’s 745. One caveat the worst-ten table makes obvious: the sample ends mid-drawdown. The -12.51% episode that started on 1 July 2026 is still (open) at 31 August, and four of the ten deepest drawdowns started in 2026, the out-of-sample year.
| Started | Recovered | Drawdown | Days |
|---|---|---|---|
| 2026-05-14 | 2026-05-27 | -12.75% | 14 |
| 2026-07-01 | (open) | -12.51% | 62 |
| 2026-02-26 | 2026-03-23 | -12.09% | 26 |
| 2026-06-04 | 2026-06-19 | -11.59% | 16 |
| 2025-03-20 | 2025-05-22 | -11.32% | 64 |
| 2021-02-22 | 2021-03-31 | -10.51% | 38 |
| 2024-09-30 | 2025-02-07 | -10.42% | 131 |
| 2017-11-22 | 2018-01-02 | -10.37% | 42 |
| 2019-11-20 | 2020-06-18 | -10.32% | 212 |
| 2022-01-17 | 2022-03-03 | -9.79% | 46 |
Rolling metrics
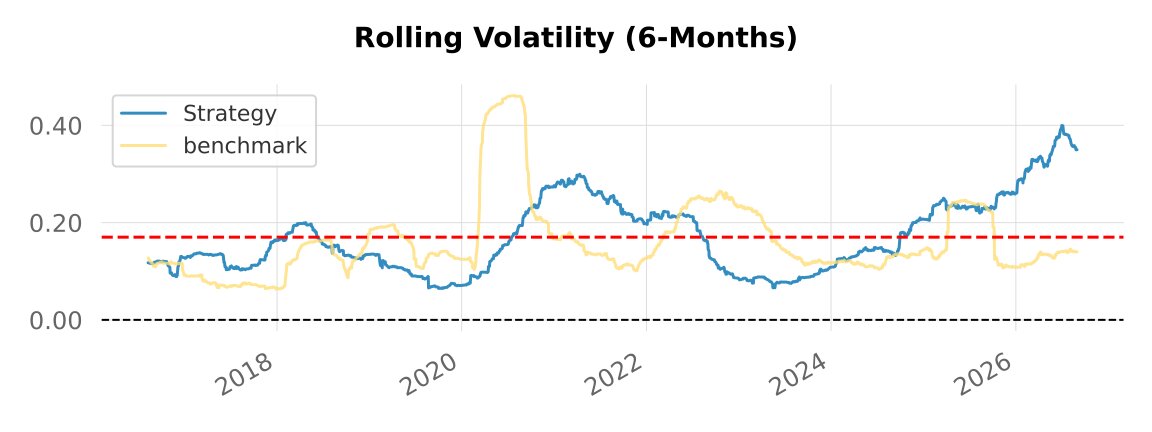
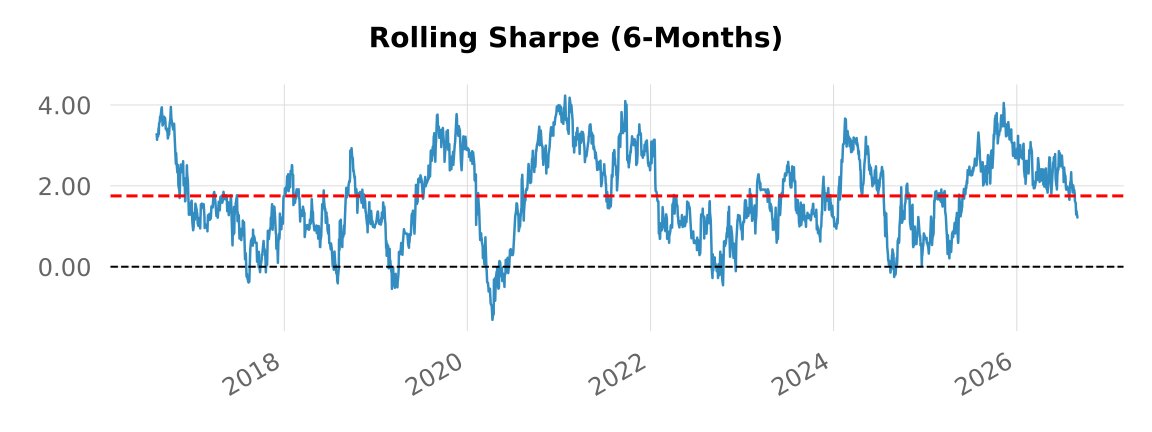
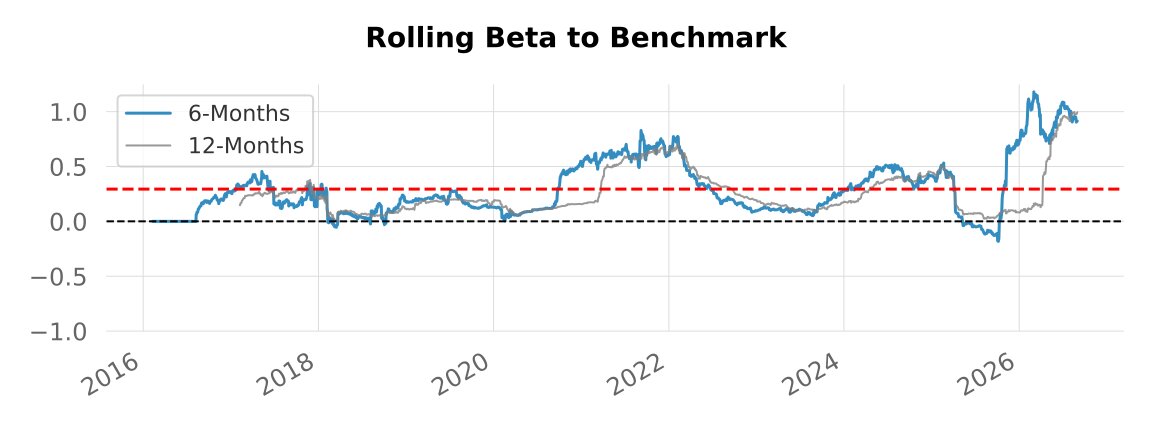
Return distribution
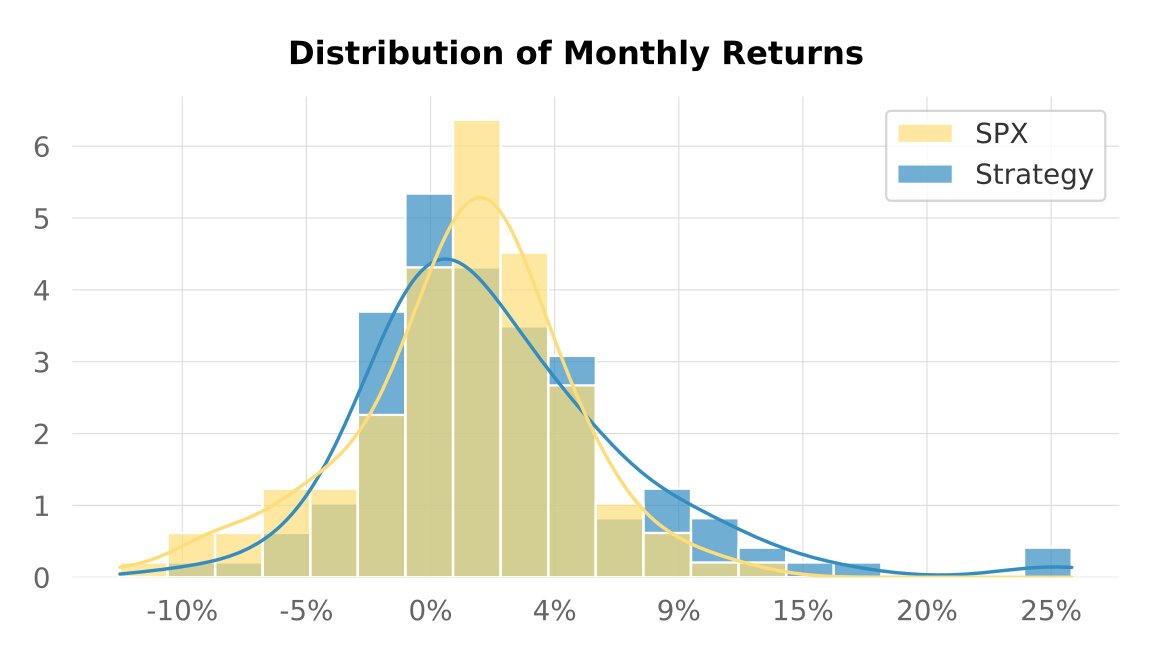
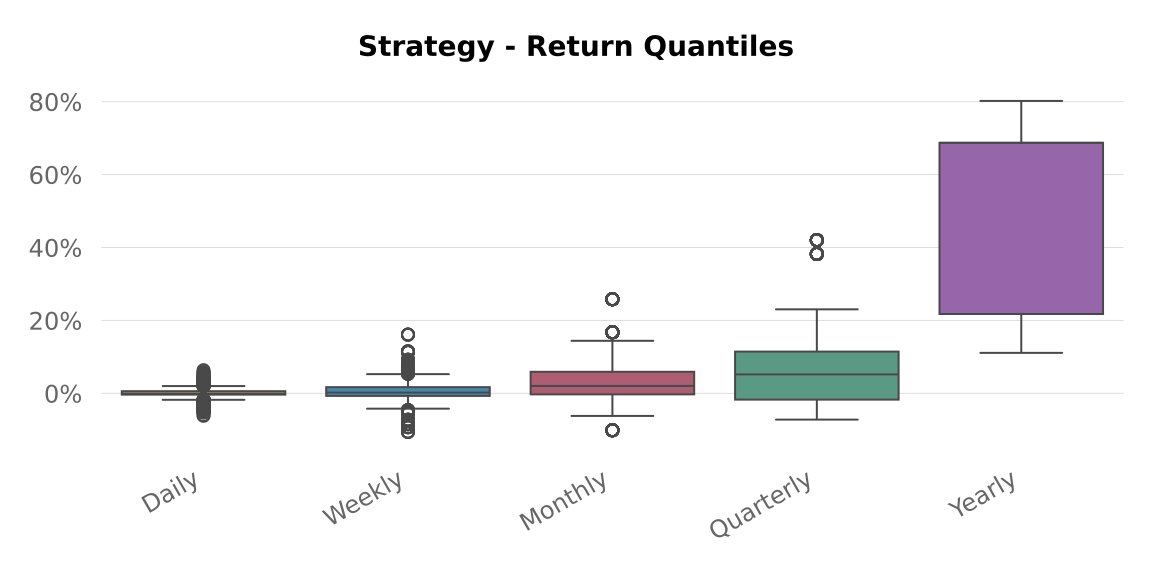
Two distribution stats deserve attention for once in a favorable direction: skew of +0.07 and kurtosis of 4.29, against -0.38 and 16.67 for the benchmark. This is close to a well-behaved, near-normal return profile rather than the outlier-driven ones that make some backtest CAGRs fragile. It does not prove the edge is durable, but the compounding here is carried by the broad middle of the distribution, not by a handful of lucky up-days.
Robustness checks
Three internal validation passes ran with the evaluation. None of them is a guarantee; all of them are reported here because a backtest without them is decoration.
- Leave-one-out on the largest contributors (grade B). Dropping any single one of the three names with the largest realized contribution leaves the CAGR between 33.5% and 34.2% (each single drop scores A). Dropping all three together still compounds at 31.8% with Sharpe 0.94. The result is not the story of one lucky ticker, but the combined removal is where the profile softens – hence the B.
- In-sample to out-of-sample drift (grade B). Per-metric grades are A on CAGR, Sharpe, risk-reward and max drawdown, and B on win rate, which drifts from 53.1% in-sample to 48.3% out-of-sample. Modest degradation, the honest direction.
- Out-of-sample forward year. The 2026 forward window annualizes to roughly 80% CAGR on 116 trades, with +47.4% of return in eight months. That sample is far too short and thin to read as proof of anything; it is reported for completeness and should not be extrapolated.
Caveats & reading guide
- This is a backtest, not a live track record. Trades are simulated on historical daily bars; real-world execution would face additional slippage, partial fills, and venue-specific frictions.
- Out-of-sample cutoff (hard). This strategy’s rules and parameters were frozen on 3 July 2025; all performance after that date is genuine out-of-sample / forward-tracked data – unseen at selection time, with no hindsight possible.
- Early-window softness. Parameter selection used the early portion of the window; results from 2020 onward give a more honest read of out-of-sample behavior. The 2016-2017 stretch is part of the honest picture.
- Open drawdown at the sample edge. The -12.51% episode from 1 July 2026 is still open when the data ends on 31 August 2026. Four of the ten deepest drawdowns started in 2026.
- Not independent of Backtest 308. ρ = 0.89 with that run means this is a sibling configuration of the same rule family, not a second, uncorrelated edge.
- Risk-free rate. The QuantStats report uses an annual RF of 14.29%, which mechanically suppresses the printed Sharpe. An RF-flat internal calculation reports Sharpe 1.10, Sortino 1.23 and Calmar 2.74.
- Costs. Transaction costs, a value-traded borrow-fee model (0.8%) and a 1.5% margin spread are modeled at the bar level; the strategy turns over ~70 trades per year on average (764 total).
- Universe survivorship on tickers (severe). The universe is the 2026 composition of those indices. There is no point-in-time record of index membership: the same 942 names are carried back through the whole window, every one of them known ex post to still be in the index in 2026, while tickers that entered or left the indices between 2016 and 2026 are missing or wrongly present. Results measured on such a universe are flattered by that selection; read the headline numbers as an upper bound, not as an estimate.
- Breadth and liquidity. A 942-name universe includes thinner names. Real fills on the thinnest would be worse than the bar-level model assumes.
- Distribution. Skew +0.07 and kurtosis 4.29 are the healthy reading of these numbers (see return distribution above), but a near-normal profile is a property of this sample, not a promise about the next one.
Discuss this backtest
We share backtest research, methodology notes and discussion on our free community channels – Telegram, Discord, X. Full details and the bilingual disclaimer on the community page.
KreamEdge publishes systematic strategy backtests and market analytics for informational and educational purposes only – not personalized investment advice. We would not trade the configuration shown here as-is; it is research. Past performance is not indicative of future results.
Frequently asked questions
What universe and period does Backtest 333 cover?
942 constituents of large world indices on daily bars, denominated in USD, simulated from 1 January 2016 to 31 August 2026 with indicator warm-up from December 2014. It is a long-only systematic strategy with $100,000 of initial capital and no leverage. The constituent list is the 2026 index composition, not a point-in-time reconstruction: historical index entries and exits are not tracked, which leaves the whole window exposed to a substantial survivorship bias on tickers.
How does Backtest 333 relate to Backtest 308?
The two runs share the same rule family, with a daily-return correlation of ρ = 0.89. Backtest 333 runs on 942 names instead of 1,006 (no KOSPI 50), tracks four extra months to August 2026, and uses an independently re-tuned parameterization including a 27% trailing stop instead of 28%. Treat it as a sibling variant of Backtest 308, not as independent confirmation.
What were the headline results?
A CAGR of 34.9% against 14.4% for the SPX total-return benchmark, with a maximum drawdown of 12.75% against the benchmark’s 33.92%, on 764 trades at a 52% win rate. With the report’s risk-free rate removed, the internal Sharpe is 1.10 and the Calmar ratio 2.74.
What was the worst drawdown and did it recover?
The deepest drawdown was 12.75%, from 14 to 27 May 2026, and it recovered within two weeks. A second drawdown of 12.51% began on 1 July 2026 and was still open when the sample ended on 31 August 2026, so the record closes before that episode resolves.
Are costs and slippage modeled, and where does out-of-sample start?
Transaction costs, a value-traded borrow-fee model at 0.8% and a 1.5% margin spread are applied at the bar level, which is a simplification of real execution. The rules and parameters were frozen on 3 July 2025, so everything after that date is genuine out-of-sample, forward-tracked performance. That forward window is still short: 2026 alone covers 116 trades.
Related KreamEdge research
- Systematic 1D strategy on world indices + KOSPI 50 (Backtest 308)
- Combined US-equities + world-indices 1D portfolio (Backtest 332)
- Systematic 1D strategy on world major indices (Backtest 265)
- Systematic 1D strategy on world indices (Backtest 92)
- Why most trading backtests are misleading (methodology)

0 Comments