Backtest 382 evaluates a long-only, daily-bar systematic strategy on a universe of 942 world major-index constituents from 1 January 2016 to 31 August 2026 (≈ 10 years 8 months). Over that window the strategy compounds to a CAGR of 36.7% versus the S&P 500 total-return benchmark at 14.3%, with a max drawdown of -18.41% against the benchmark’s -33.92%. Read the distribution sections before the headline: this record is outlier-driven to an extreme.
This is a historical backtest, not a live track record and not a trading signal. We would not trade it as-is: it is research only. Past performance is not indicative of future results. Content is published for informational and educational purposes only – see the closing notes and our community page for the full disclaimer.
Headline numbers
| Metric | Strategy | Benchmark (SPX TR) |
|---|---|---|
| Period | 2016-01-01 → 2026-08-31 | |
| CAGR | 36.71% | 14.25% |
| Cumulative return | +2,664% | +311% |
| Max drawdown | -18.41% | -33.92% |
| Longest DD (days) | 672 | 745 |
| Volatility (annualized) | 34.49% | 17.82% |
| Sharpe | 0.65 | 0.09 |
| Sortino | 1.81 | 0.13 |
| Calmar | 1.99 | 0.42 |
| Time in market | 77% | 97% |
| Gross exposure (avg) | 32% | – |
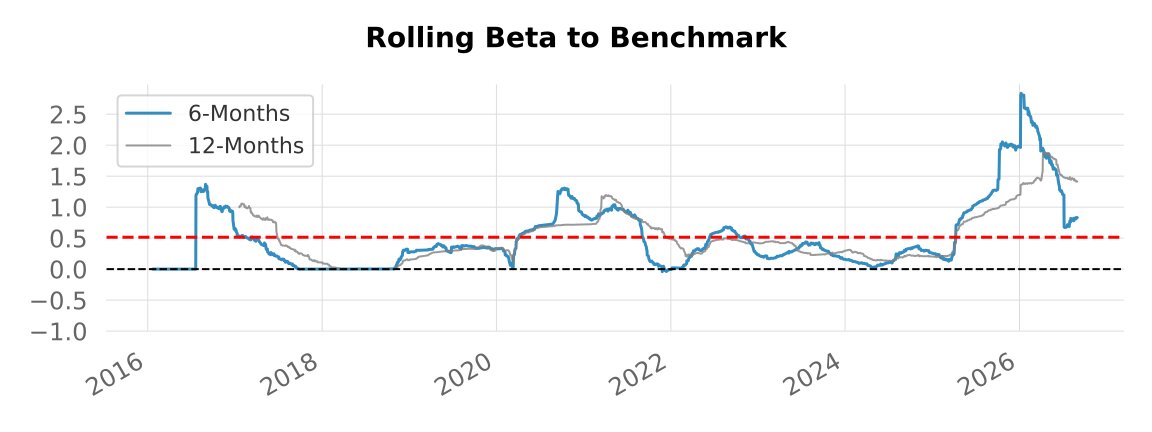
| Beta to SPX | 0.62 | – |
| Trades | 145 | – |
| Win rate | 66.21% | – |
| Risk / reward | 13.17 | – |
| Skew | +30.08 | -0.37 |
| Kurtosis | 1305.25 | 16.49 |
Relation to Backtest 333
Backtest 382 runs on the same 942-name world major-index universe as Backtest 333, but with a different rule family, and the daily return streams reflect it: they correlate at only ρ = 0.21 (333 correlates 0.89 with Backtest 308, its own close sibling). Whatever else is wrong with this run, duplicate exposure to 333 is not the problem.
What differs:
- Rules. 382 enters on a composite Ichimoku + Bollinger + Chaikin-momentum gate filtered by MACD and exits on Ichimoku + MACD, with a 31% trailing stop. 333 enters on a MACD variant and exits on Ichimoku + Parabolic-SAR with a 27% stop.
- Activity. 145 trades at 32% average gross exposure over the window, against 333’s 764 trades at 47%. This book sits in cash most of the time.
- Result shape. 333’s returns are near-normally distributed (skew +0.07). 382’s skew is +30 and its kurtosis 1305: a handful of extreme winners carry almost everything (see return distribution).
Treat the two as complementary studies of one universe, not as two estimates of one number.
Universe & period
The universe is the major-indices zone – 942 constituents of large world indices, daily bars, denominated in USD. The constituent list is the index composition as of 2026: the simulation carries those names back through the whole window and does not track which tickers entered or left the indices over time, which is a large survivorship bias on tickers (see the caveats). The simulation warms up indicators from 2014-12-19 and starts compounding from 2016-01-01 with $100,000 of initial capital, ending 2026-08-31.
Strategy in plain English
- Long-only, no shorts, no leverage.
- Entry: a composite trigger requiring Ichimoku, Bollinger-band and Chaikin-momentum conditions together, gated by a MACD filter (internally
(ichimoku4a+bband1a+cho1a)&macd0b). - Exit: Ichimoku and MACD conditions (internally
ichimoku3a&macd0a), combined with a 31% trailing stop. - Sizing: volatility-targeted at the portfolio level, position cap 20%, sector cap 33%, max 10 new entries per bar.
- Cooldown: a freeze of 2 bars after each exit to avoid immediate re-entries.
- Regime awareness: a 252-bar percentile-based regime filter. Over the test window bars classify as ~78% trend, ~7% range, ~14% bear (see our follow-up null-result study on whether this filter actually improves backtest outcomes) – the strategy is permitted in all three but sizes down outside trend.
Equity curve
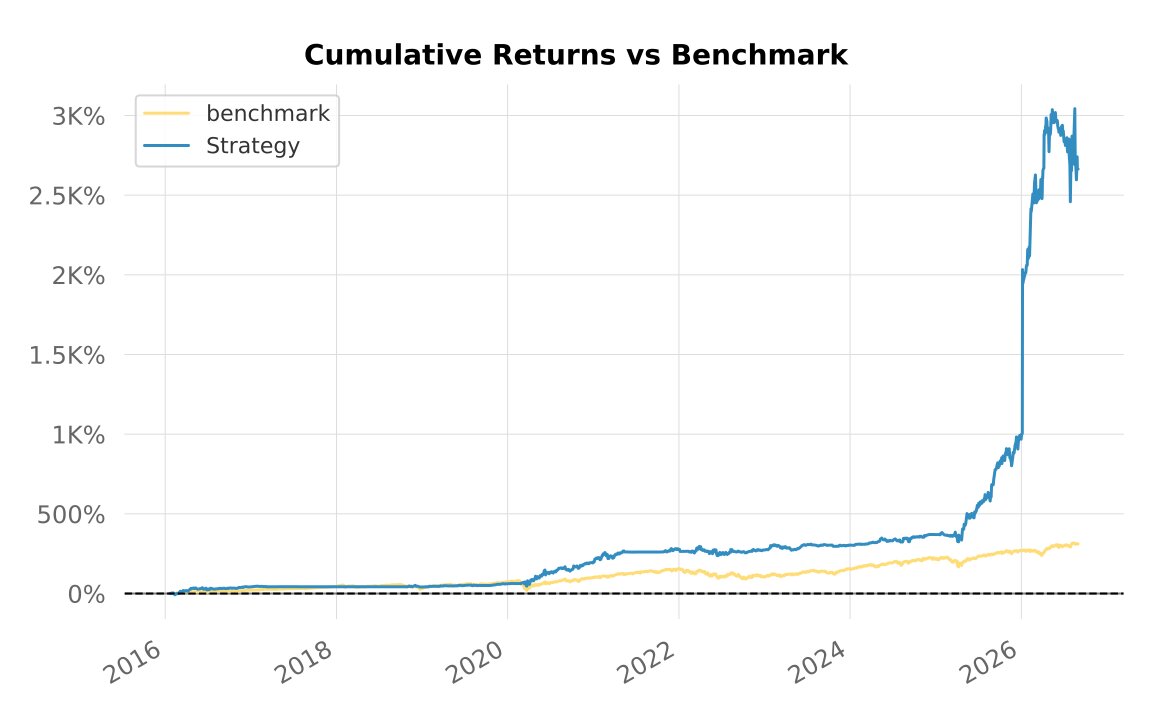
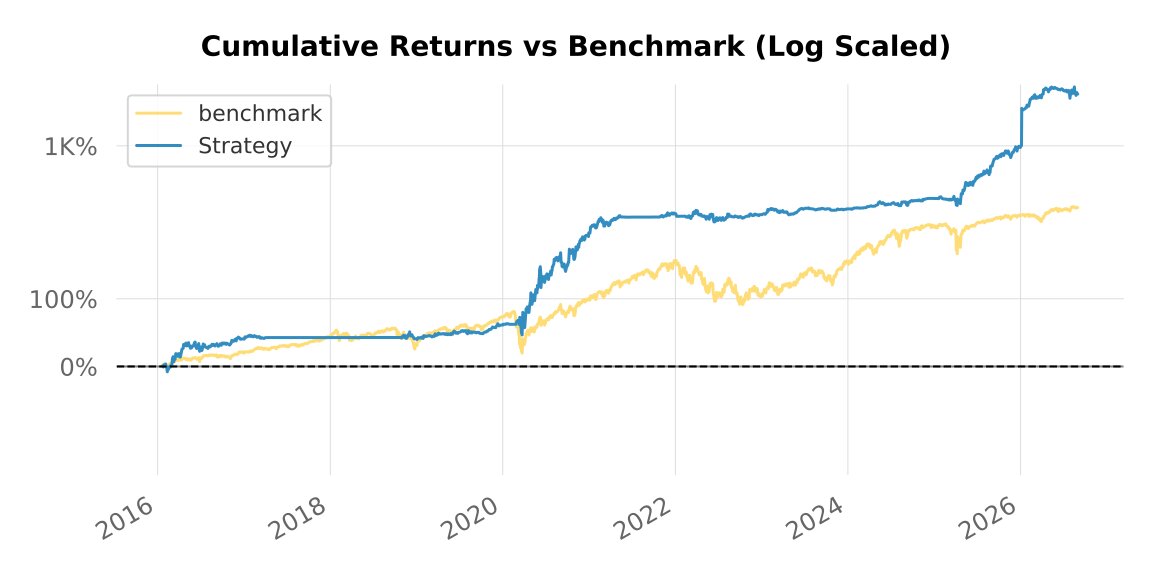
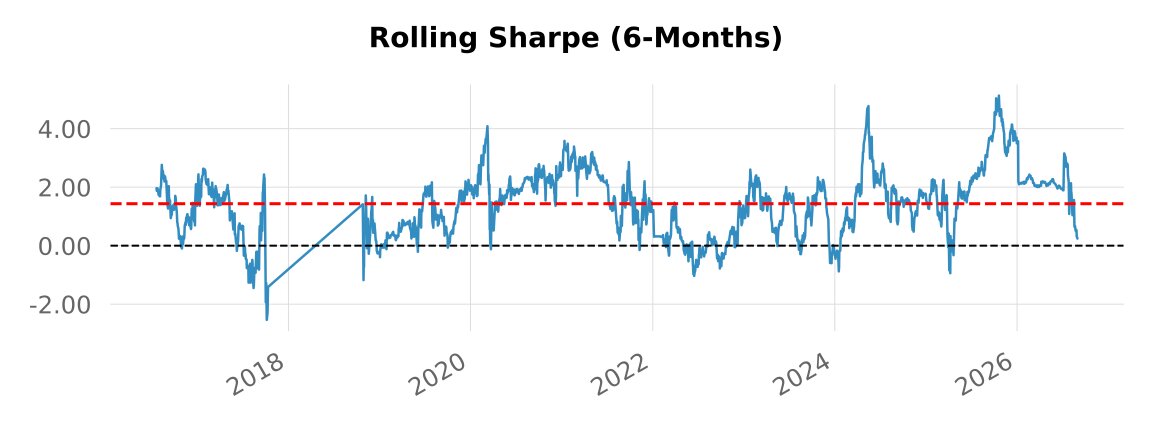
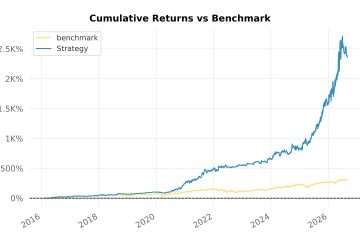
The out-of-sample degradation is visible on these curves. Watch the right edge: the steep2025-2026 line ends in a rollover, with the since-inception annualized return peaking around 39% in May-June 2026 and closing near 37%. The curve gives back 18.41% between mid-May and mid-August 2026, then falls a further 14.20% into the episode that is still open on 31 August, and June to August 2026 returns -10.1%. The engine’s forward metrics agree in numbers: out-of-sample win rate 53.6% against 67.0% in-sample, and a forward Sharpe of -0.89 against 0.82. The last segment of the curve is the out-of-sample performance degrading in plain sight.
Annual returns
| Year | SPX | Strategy | Multiplier | Won |
|---|---|---|---|---|
| 2016 | 19.79% | 40.43% | 2.04 | + |
| 2017 | 19.42% | 1.56% | 0.08 | – |
| 2018 | -6.24% | -1.22% | 0.20 | + |
| 2019 | 28.88% | 14.47% | 0.50 | – |
| 2020 | 16.26% | 83.80% | 5.15 | + |
| 2021 | 26.89% | 27.02% | 1.00 | + |
| 2022 | -19.44% | -1.13% | 0.06 | + |
| 2023 | 24.23% | 8.51% | 0.35 | – |
| 2024 | 23.31% | 16.47% | 0.71 | – |
| 2025 | 16.39% | 127.09% | 7.76 | + |
| 2026* | 12.25% | 158.71% | 12.95 | + |
Drawdown analysis
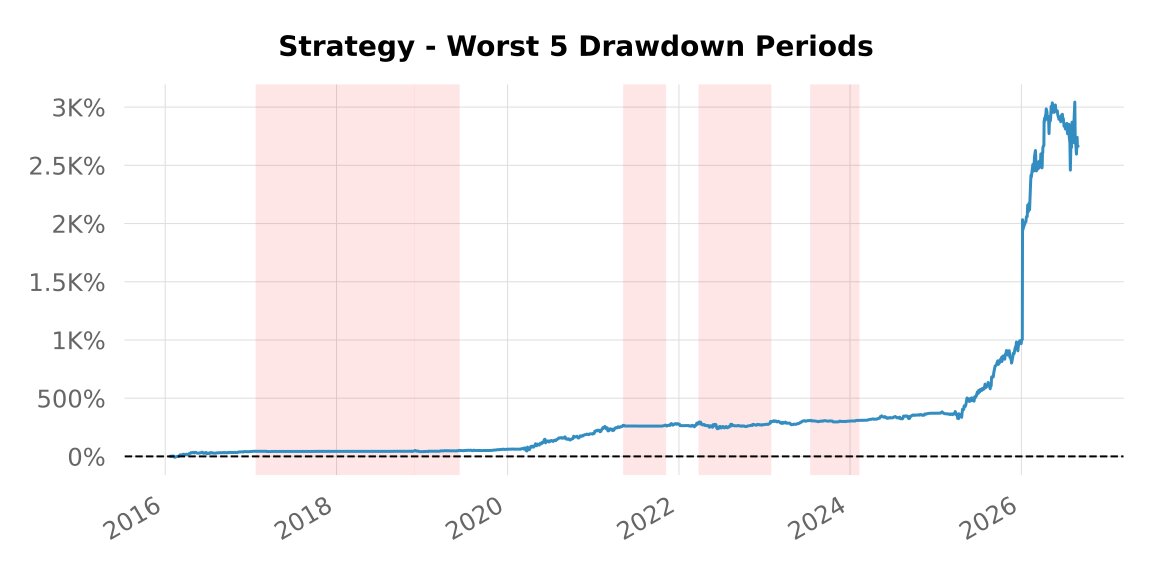
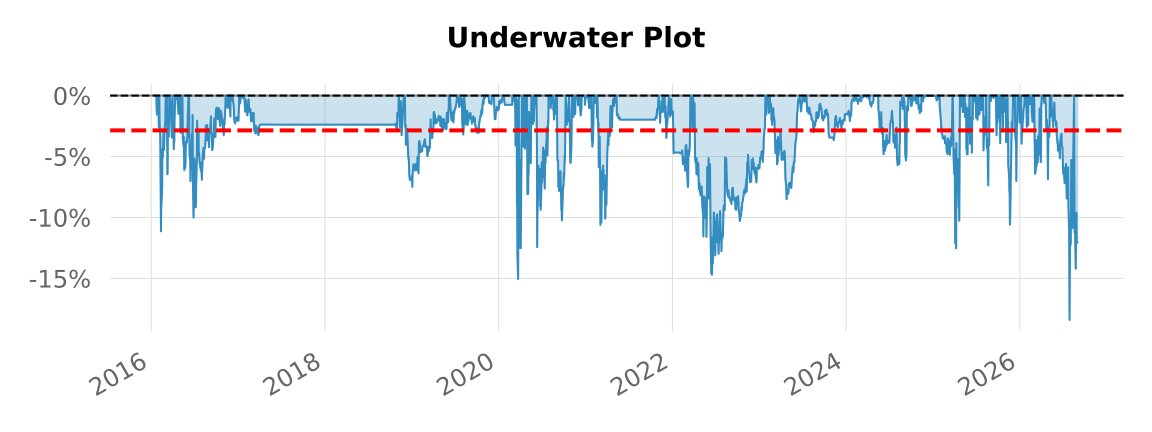
The deepest drawdown sits at -18.41% (14 May to 14 August 2026), against the benchmark’s -33.92%. The longest stretch under the previous peak ran 672 days. The worst-ten table shows the record is still in trouble at the sample edge: the -14.20% episode from 18 August 2026 is (open) when the data ends on 31 August, right after a -18% peak-to-trough that had only just recovered.
| Started | Recovered | Drawdown | Days |
|---|---|---|---|
| 2026-05-14 | 2026-08-14 | -18.41% | 93 |
| 2020-03-16 | 2020-03-25 | -15.05% | 10 |
| 2022-03-30 | 2023-01-26 | -14.70% | 303 |
| 2026-08-18 | (open) | -14.20% | 14 |
| 2025-03-26 | 2025-04-23 | -12.53% | 29 |
| 2020-03-27 | 2020-04-07 | -12.52% | 12 |
| 2020-06-09 | 2020-07-30 | -12.44% | 52 |
| 2016-02-05 | 2016-03-01 | -11.14% | 26 |
| 2021-02-22 | 2021-05-03 | -10.61% | 71 |
| 2025-10-30 | 2025-12-03 | -10.60% | 35 |
Rolling metrics
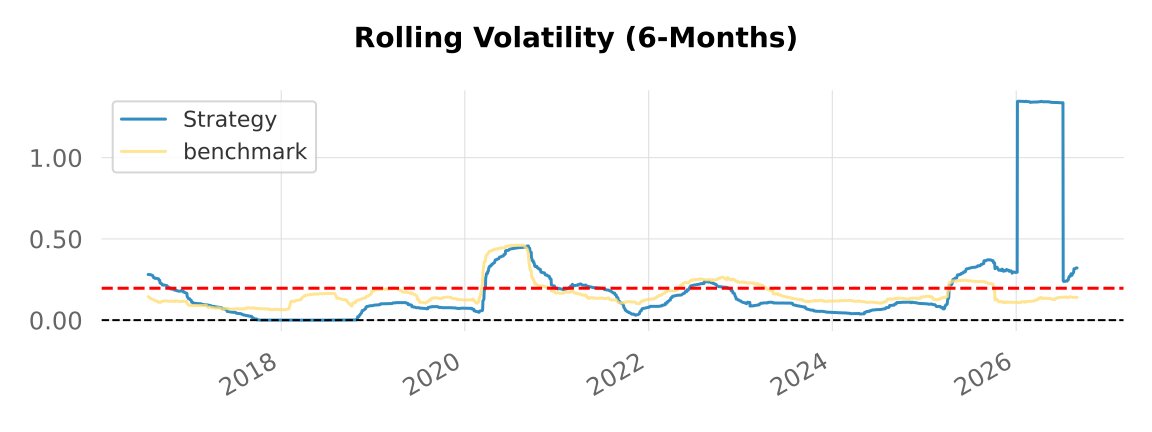
Return distribution
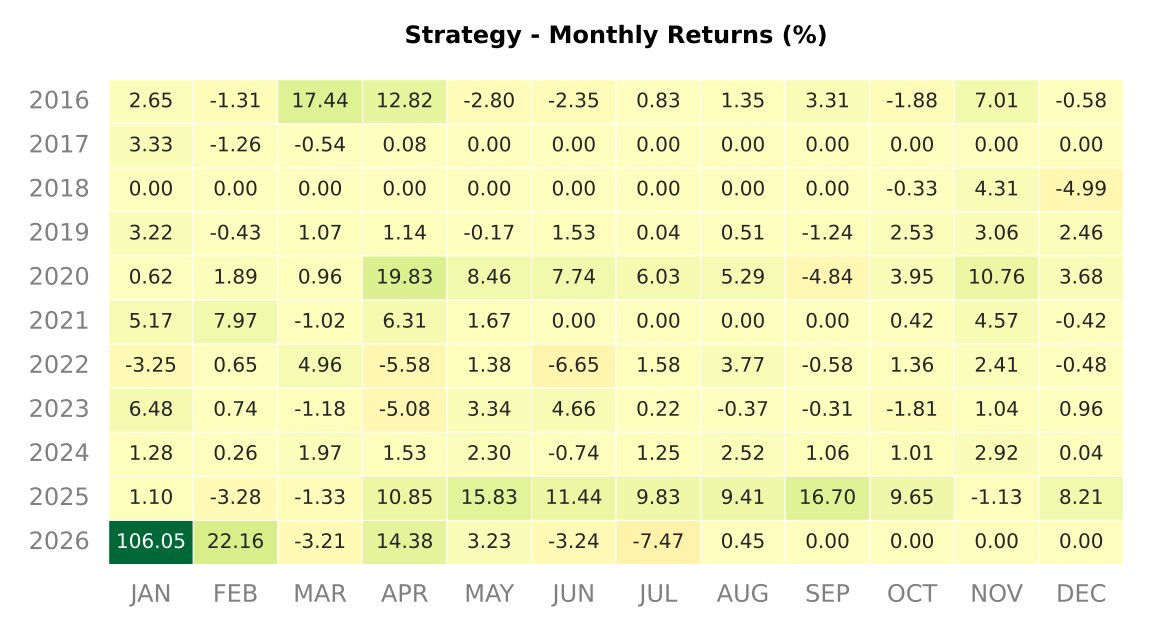
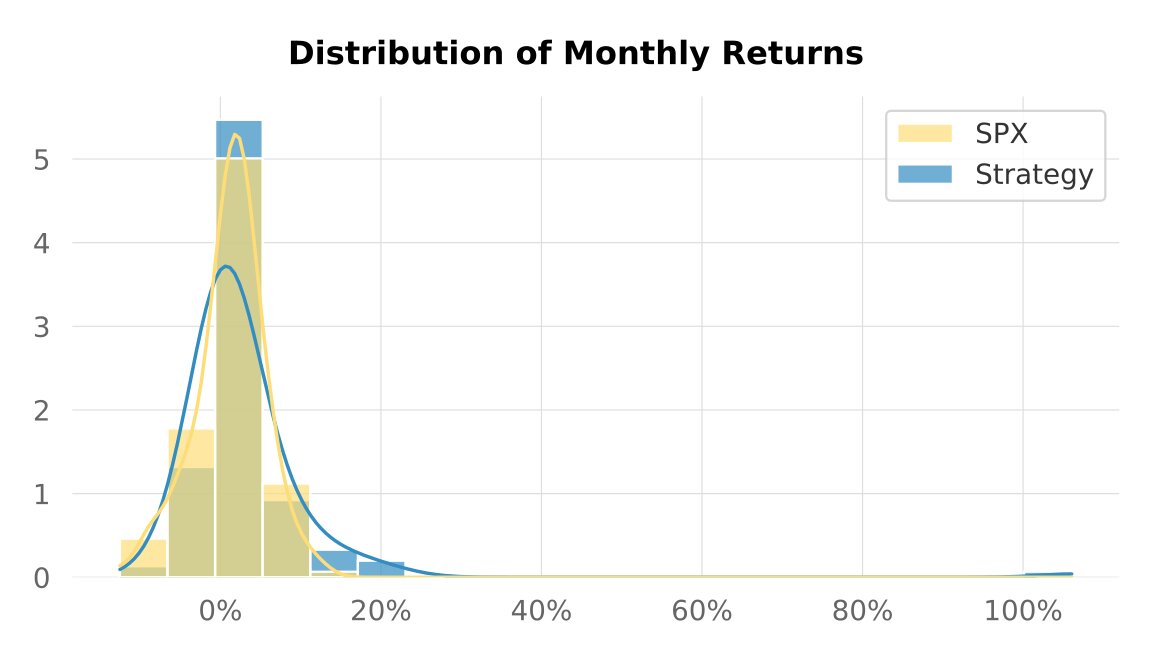
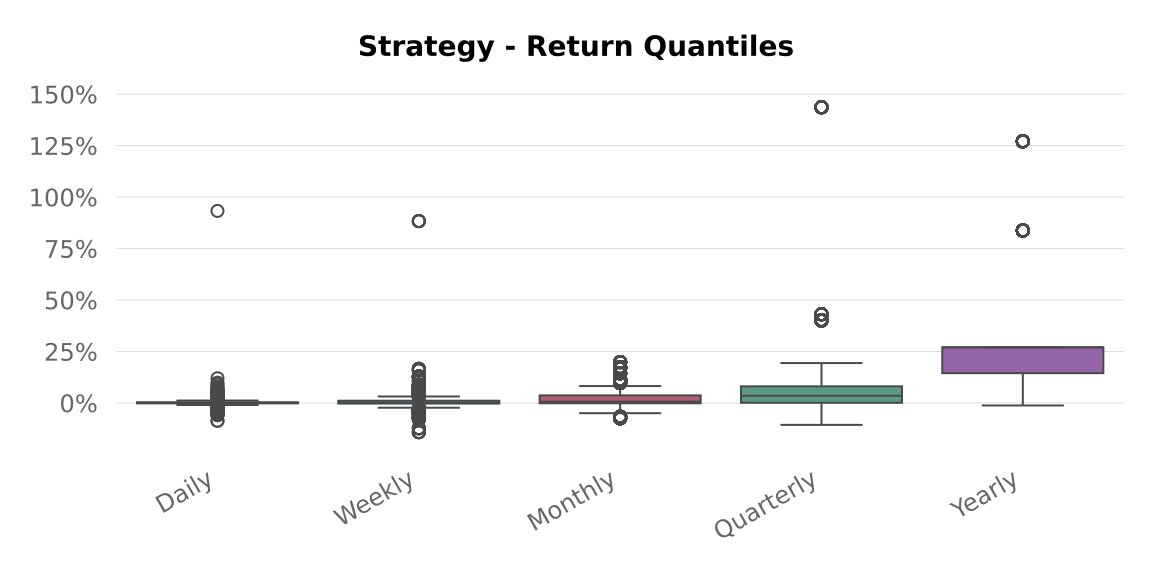
This is the section that decides how much the headline CAGR is worth. Skew is +30.08 and kurtosis 1,305.25, against -0.37 and 16.49 for the benchmark. For comparison, the fragile-but-plausible profile we flagged on Backtest 317 was skew +3.33 and kurtosis 57. The risk/reward ratio of 13.17 on 145 trades says the same thing from another angle: average winners dwarf average losers, which is what a distribution with one or two catastrophic right-tail events looks like from the inside.
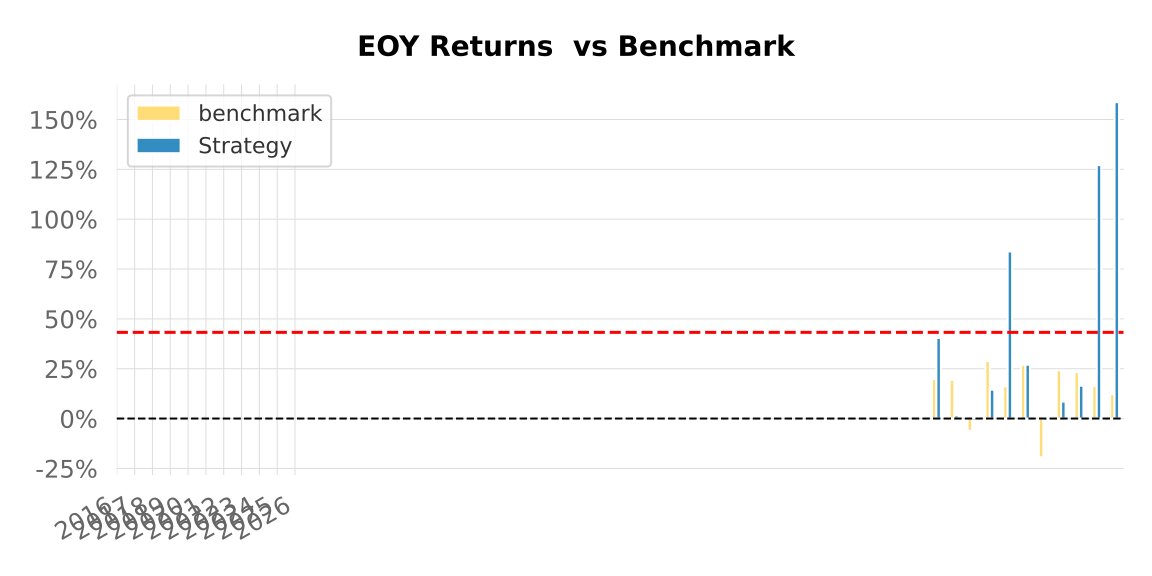
The daily return stream names the mechanism: 6 January 2026 alone returned +93%, more than seven times the next-largest day in the window. Strip that single session out of 2026 and the year’s +158.71% falls to roughly +34%. One session is not a track record; it is a drawdown waiting to be given back in the other direction. Read the compounding curve as the story of a few extreme winners, not as a repeatable edge ground out over 2,774 sessions.
Robustness checks
Three internal validation passes ran with the evaluation. On this run they mostly say no.
- Leave-one-out on the largest contributors (grade F, flagged drifted). Dropping the single largest contributing name takes the CAGR from 36.7% to 27.7% and the risk/reward from 13.2 to 5.2. Dropping the top three together leaves CAGR 23.7% at Sharpe 0.51. Both variants are graded F and flagged as drifted from the baseline. By contrast, the same test on Backtest 333 was grade B with barely a dent. This result depends materially on a few names.
- In-sample to out-of-sample drift: not assessable. The drift analysis returns insufficient data: the post-freeze window carries only 28 closed trades. For the record it prints in-sample Sharpe 0.82 against a forward figure of -0.89, but with a sample that thin neither number is evidence of anything.
- Out-of-sample forward window. 28 trades, a negative risk-adjusted return, and the open -14.20% drawdown at the sample edge. The 2025-2026 headline gains sit mostly in the in-sample period and in a few extreme days. Do not read the recent run as forward validation.
Caveats & reading guide
- Universe survivorship on tickers (severe). The universe is the 2026 composition of those indices. There is no point-in-time record of index membership: the same 942 names are carried back through the whole window, every one of them known ex post to still be in the index in 2026, while tickers that entered or left the indices between 2016 and 2026 are missing or wrongly present. Results measured on such a universe are flattered by that selection; read the headline numbers as an upper bound, not as an estimate.
- Extreme outlier dependence. Skew +30.08, kurtosis 1,305.25, risk/reward 13.17 on 145 trades, and one session (6 January 2026) worth +93%. The leave-one-out test fails on exactly this (grade F). A CAGR with this shape is the most fragile kind of backtest number.
- This is a backtest, not a live track record. Trades are simulated on historical daily bars; real-world execution would face additional slippage, partial fills, and venue-specific frictions. A book that trades 145 times in ten years would also face live risk on positions it holds for months.
- Out-of-sample cutoff (hard). This strategy’s rules and parameters were frozen on 3 July 2025; all performance after that date is genuine out-of-sample / forward-tracked data – unseen at selection time, with no hindsight possible. On this run that window is thin (28 closed trades) and it ends in an open drawdown.
- Early-window softness. Parameter selection used the early portion of the window; results from 2020 onward give a more honest read of out-of-sample behavior. The flat 2017-2019 stretch is part of the honest picture.
- Open drawdown at the sample edge. The -14.20% episode from 18 August 2026 is still open when the data ends on 31 August 2026.
- Risk-free rate. The QuantStats report uses an annual RF of 14.19%. An RF-flat internal calculation reports Sharpe 0.66, Sortino 1.97 and Calmar 2.00.
- Costs. Transaction costs, a value-traded borrow-fee model (0.8%) and a 1.5% margin spread are modeled at the bar level. Low turnover (~15 trades per year) cuts one source of model error but lengthens holding-period risk.
- Breadth and liquidity. A 942-name universe includes thinner names. The large winners that carry this result may be exactly the names where bar-level fills are least realistic.
Discuss this backtest
We share backtest research, methodology notes and discussion on our free community channels – Telegram, Discord, X. Full details and the bilingual disclaimer on the community page.
KreamEdge publishes systematic strategy backtests and market analytics for informational and educational purposes only – not personalized investment advice. We would not trade the configuration shown here as-is; it is research. Past performance is not indicative of future results.
Frequently asked questions
What universe and period does Backtest 382 cover?
942 constituents of large world indices on daily bars, denominated in USD, simulated from 1 January 2016 to 31 August 2026 with indicator warm-up from December 2014. The constituent list is the 2026 index composition, not a point-in-time reconstruction: historical index entries and exits are not tracked, which leaves the whole window exposed to a substantial survivorship bias on tickers.
What were the headline results?
A CAGR of 36.7% against 14.3% for the SPX total-return benchmark, with a maximum drawdown of 18.41% against the benchmark’s 33.92%, on 145 trades at a 66% win rate. The shape of those returns is the catch: skew +30 and kurtosis 1305 mean a few extreme winners carry the result, and the headline should be read as an upper bound.
How does Backtest 382 relate to Backtest 333?
Same 942-name universe, different rule family. The daily return streams correlate at only 0.21, so the two studies add genuine diversification to each other. Backtest 382 enters on an Ichimoku + Bollinger + Chaikin composite gated by MACD and exits on Ichimoku + MACD with a 31% trailing stop, against Backtest 333’s MACD entry and Ichimoku + Parabolic-SAR exit. The trade profiles differ just as much: 145 trades at 32% exposure here versus 764 at 47% there.
Why does this backtest fail its leave-one-out test?
Because the result depends on a handful of names. Removing the single largest contributing ticker drops the CAGR from 36.7% to 27.7% and the risk/reward ratio from 13.2 to 5.2; removing the top three drops the CAGR to 23.7% at Sharpe 0.51. Both variants are graded F and flagged as drifted from the baseline, which is the validation engine saying the edge is concentrated, not broad.
What was the worst drawdown and did it recover?
The deepest drawdown was 18.41%, from 14 May to 14 August 2026, and it recovered just before the sample ended. A second drawdown of 14.20% began on 18 August 2026 and was still open when the data ended on 31 August 2026, so the record closes mid-episode.
Related KreamEdge research
- Systematic 1D strategy on world major indices (Backtest 333)
- Systematic 1D strategy on world indices + KOSPI 50 (Backtest 308)
- Systematic 1D strategy on world major indices (Backtest 265)
- Combined US-equities + world-indices 1D portfolio (Backtest 332)
- Systematic 1D strategy on world indices (Backtest 92)
- Why most trading backtests are misleading (methodology)

0 Comments